
While July’s consumer inflation is likely to be less intense than in recent months, I don’t see it coming back down to more “normal” levels. The good news is gas; the bad news is vehicles and housing.
To begin with, gas prices have fallen about 25% from their peak at the end of June to this past weekend. To get to their “real” price, I divide by average hourly wages of nonsupervisory workers. Here’s what that looks like, with the peak of June 2008 set at 100:
(Click on image to enlarge)

In June of this year, gas prices divided by average hourly nonsupervisory wages were 79.8% of their peak. By the end of July, that had fallen to 73.5%. This is more typical of the 2005-07 period, and also the 2010-14 period of the “oil choke collar,” where gas prices backed off every time they hit a threshold that threatened to cause a consumer recession. It looks like that has happened again.
Turning to the CPI, in usual times, the price of gas is the biggest component of CPI volatility. And that is likely to be the case with this Wednesday’s report as well. My rule of thumb is to take the change in the price of gas, and divide it by about 16, and add .15% for normal background “core” inflation, to figure the most likely monthly inflation reading. Here’s what that looked in the 10 years before the pandemic:
(Click on image to enlarge)

Now here is the past 2+ years since the onset of the pandemic:
(Click on image to enlarge)
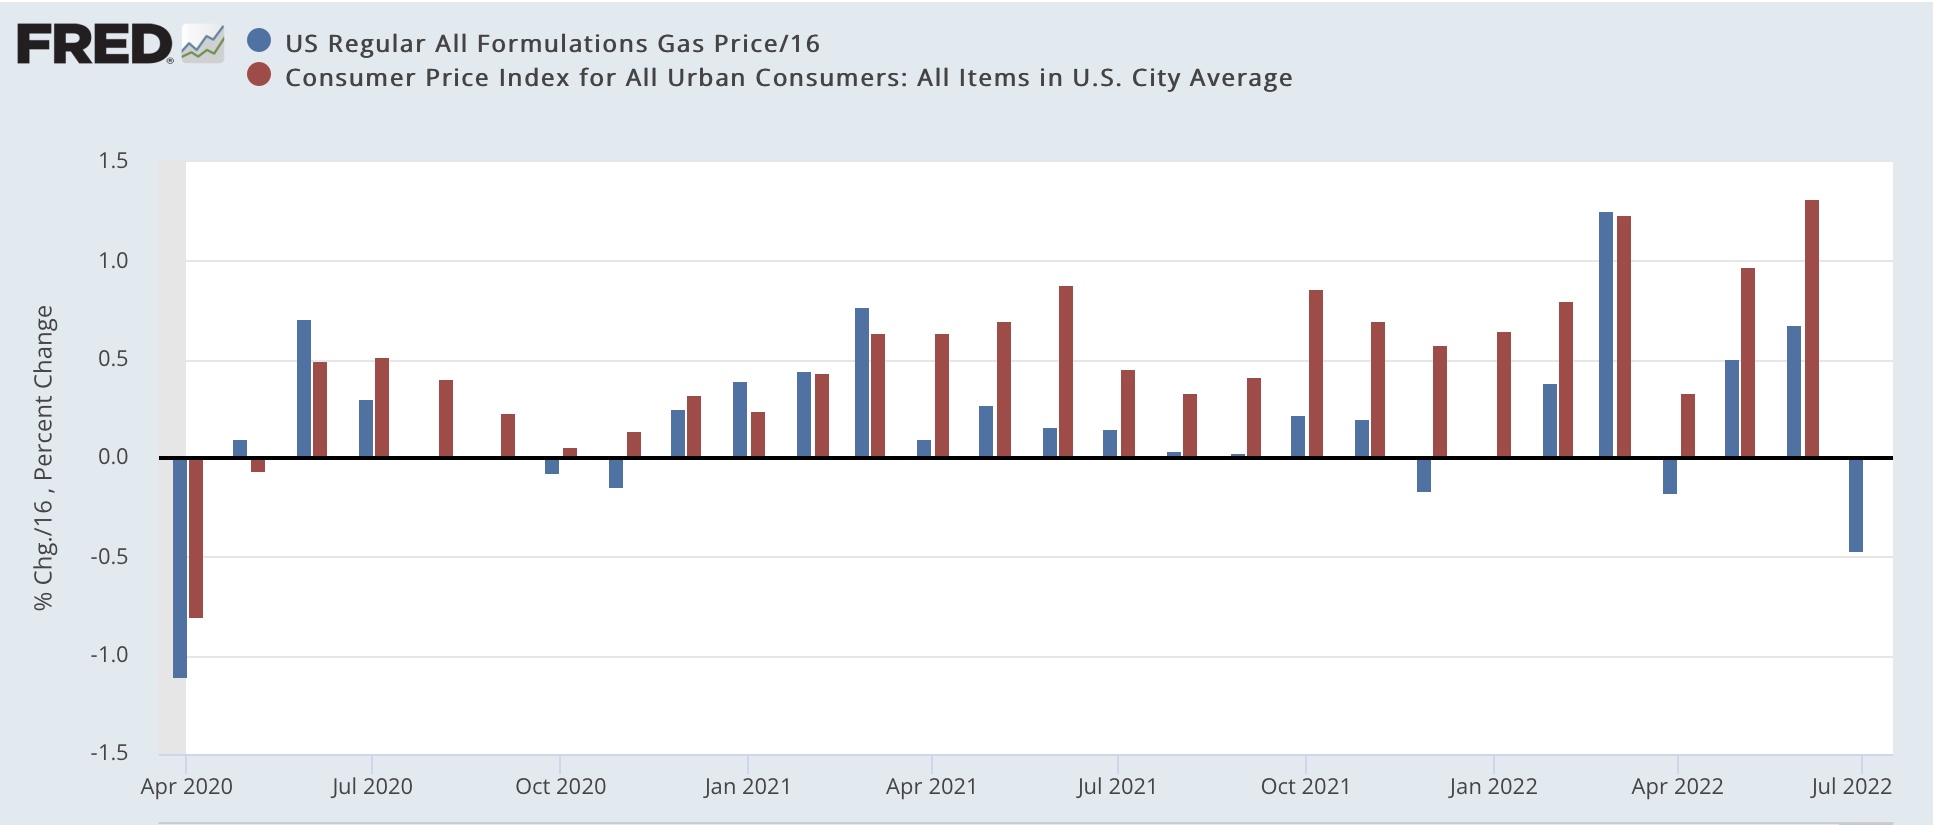
If this were “normal” times, gas would drag July consumer prices down by roughly 0.5%. Add in the background “core” inflation, and I’d expect a reading of -0.3% or -0.4%.
But these aren’t normal times, and the biggest culprit is housing inflation. A number of times in the past year I’ve run YoY% comparisons of the FHFA and Case Shiller house price indexes vs. Owners’ Equivalent Rent, the official CPI measure. Below I’ve instead used month-over-month changes to show how house prices have gradually fed into owners’ equivalent rent in the past two years:
(Click on image to enlarge)

Additionally, let me re-up this graph from Bill McBride, showing that measures of apartment lease inflation have a similar issue:
(Click on image to enlarge)

Since rents are typically increased only once a year for each tenant, it takes a full year for rent increases to filter through to the total metric.
For July, owners’ equivalent rent is likely to clock it at about +0.7%, and since it is almost 1/3rd of the entire CPI index, this is going to dwarf the impact of lower gas prices.
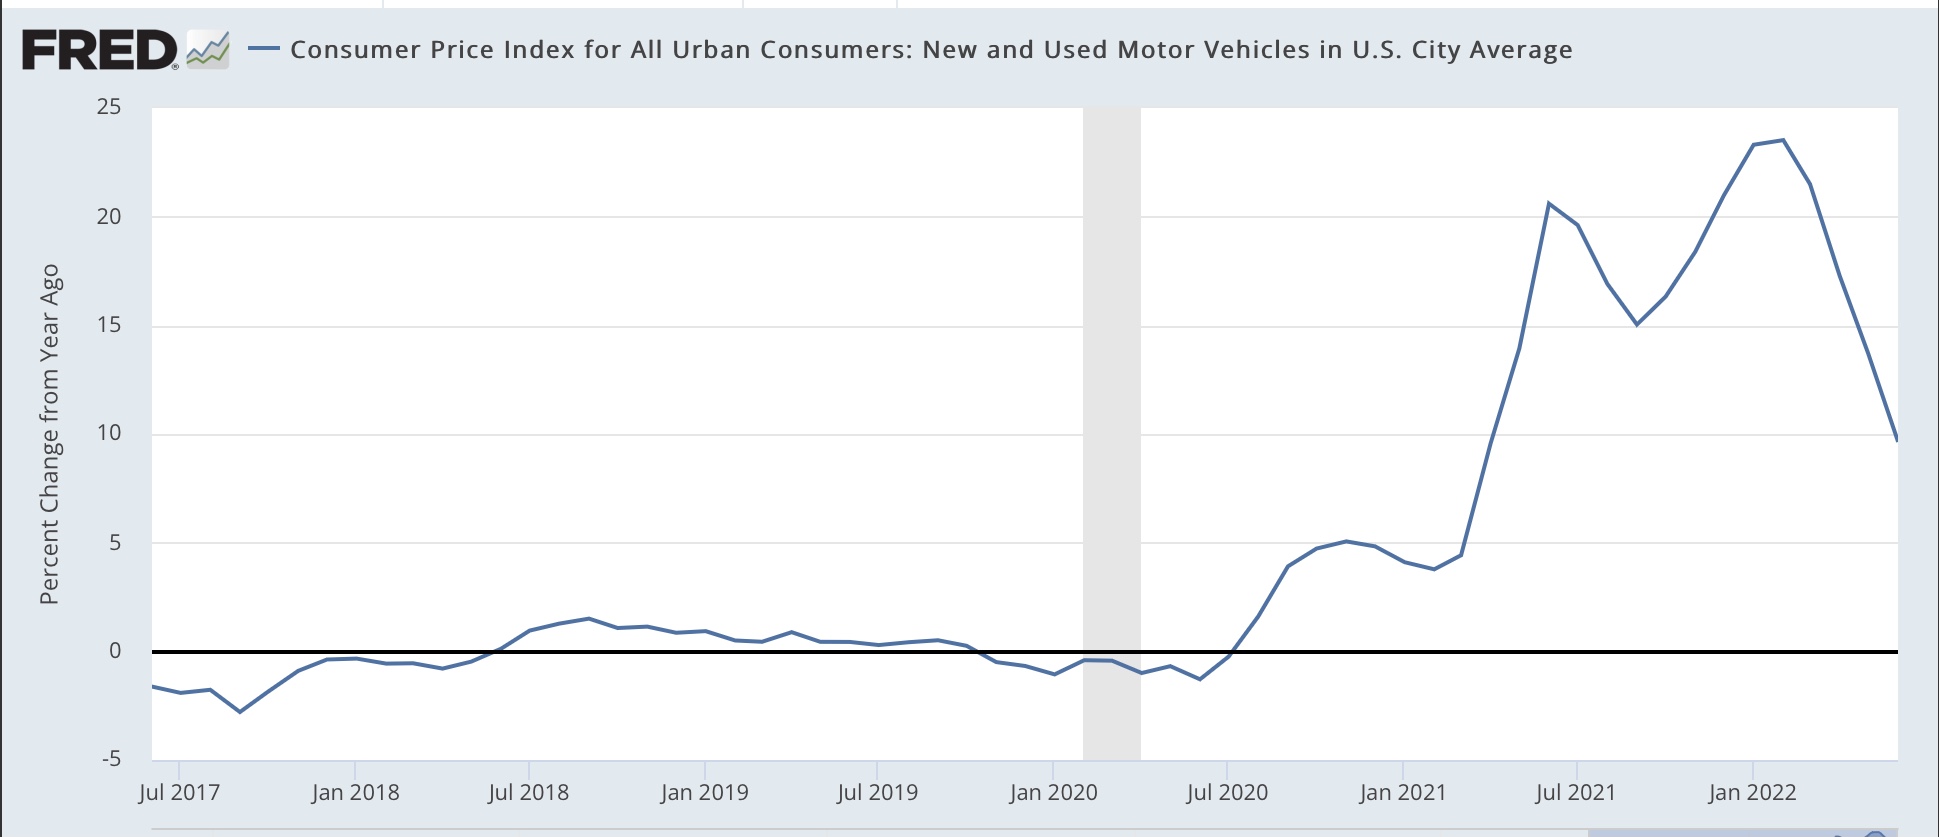
Finally, because of microchip production issues out of China, vehicle prices have also been a significant component of inflation, as shown in the YoY graph below:
(Click on image to enlarge)
But unfortunately in the past few months, there’s been no sign of further deceleration in the monthly readings:
(Click on image to enlarge)

This suggests that increases in vehicle prices are likely to persist.
So, while I expect July inflation to back off from its most recent 1%+ monthly increase, an increase in the 0.5%-0.9% ballpark seems likely.
More By This Author:
July Jobs Report: In Which An Absolute Positive Blowout Make Me Happily Wrong; All Pandemic Job Losses Now Recovered
Jobless Claims Continue Their Relentless Climb
July Manufacturing And June Construction Spending: Leading Components Of Both Are Negative


Comments
Log in or sign up to join the conversation.