
Plain Vanilla Term Spread Forecasts Of Recession
What do simple 10yr-3mo and 10yr-2yr Treasury spreads imply about recession probabilities?
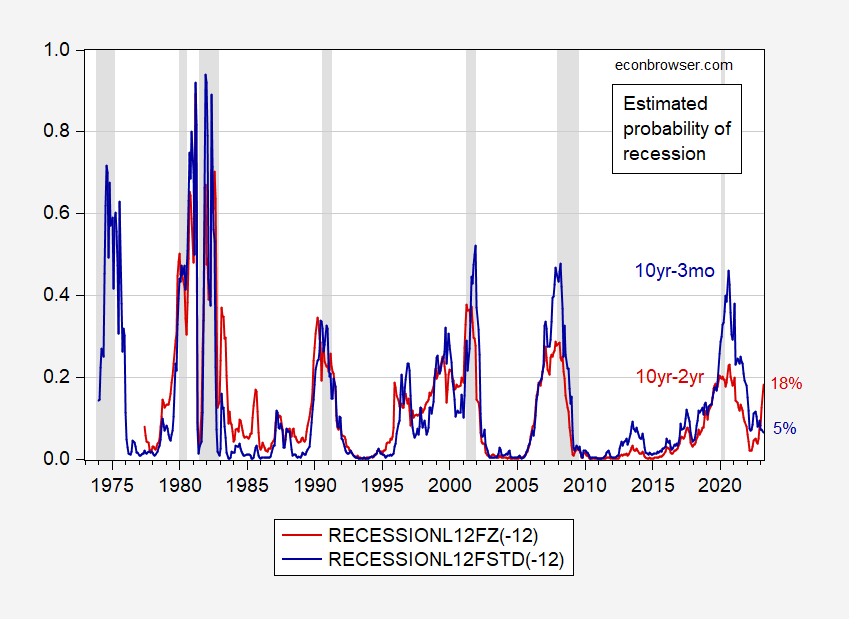
Figure 1: 12 month ahead estimated probability of recession using 10yr-3mo Treasury spread (blue), and using 10yr-2yr spread (red). NBER defined recession dates peak-to-trough shaded gray. Source: Treasury via FRED, NBER and author’s calculations.
Reflecting the drastically diverging trajectories of the spreads, the probability estimates also diverge. A common alternative specification includes the inflation adjusted level of the fed funds rate. In the detail below, I show the two forecasts above and this alternative.
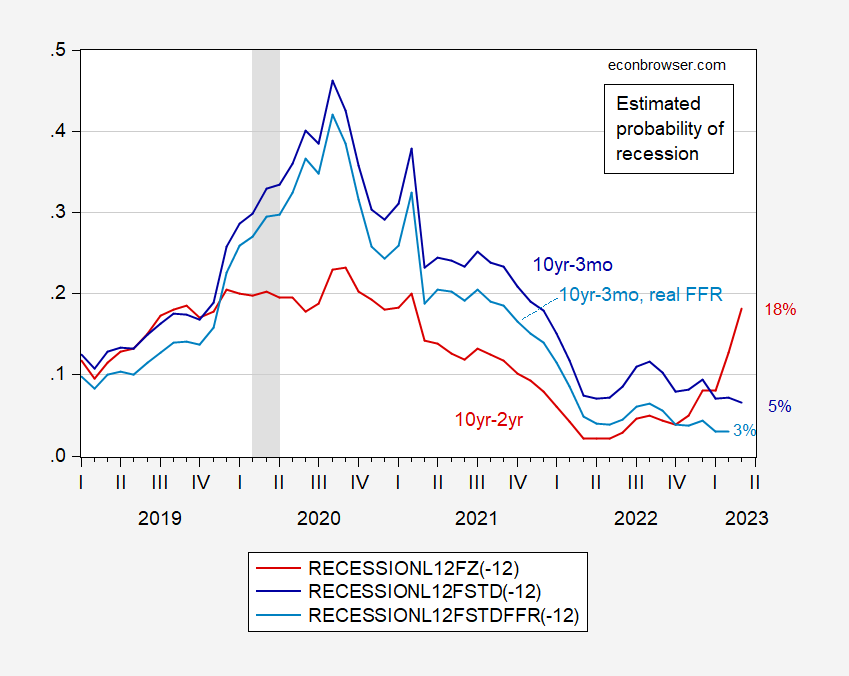
Figure 1: 12 month ahead estimated probability of recession using 10yr-3mo Treasury spread (blue), 10yr-3mo spread and fed funds minus ex post lagged inflation (light blue), and using 10yr-2yr spread (red). NBER defined recession dates peak-to-trough shaded gray. Source: Treasury via FRED, NBER and author’s calculations.
This alternative does not produce a substantially different forecast.
Hence, if past correlations hold into the future, then a recession in the next 12 months is not likely. However, it must be admitted that there are many different spreads that one can consider (see e.g. here).
Deutsche Bank notes that “the spread between the current conditions components of the University of Michigan and Conference Board surveys” is highly correlated (80%) with the 10yr-2yr spread, and concludes (1) that spread should be yet smaller, and that hence (2) there is a 50% chance of a recession in the next year (Luzzetti, Ryan, Weidner, Yang, “Consumer sentiment gap is proving prescient for curve shape,” US Economic Notes, Deutsche Bank, March 29, 2022).
Disclosure: None.


