
Hope you had a good week and enjoyed watching the big game last Sunday. It was a nail biter at the end. Whether it is a football game or investing, it is always about the “little things” that make the difference. Critical game plans and strategies always factor in. It reminds me of successful investing and trading. For us, it replicates how and why our quant models work. It’s always the small things that make the biggest difference like taking off profits and/or utilizing stops.
Higher for longer
If you are a frequent reader, you know that both Michele and I have been suggesting that inflation would likely tick up after the past few month’s plunge lower. This would likely mean interest rates could possibly go back up (they fell much too fast). We have both often stated that what investors expect will happen in a given time, rarely works out that way.
This was the case this past week. Tuesday morning (Feb 13) the CPI was released and was “hotter” than expected. As we saw in the 1970s, driving inflation down is tricky. Seldom, if ever, do economic actions result in smooth lines. We both said this towards the end of the year. My message was clear in December: volatility and higher risk would likely be more prevalent in 2024. This past week was an accurate demonstration of just that.
Peak inflation is likely behind us
Last week the CPI (Consumer Price Index) and the PPI (Producer Price Index) inflation reports confirmed that inflation continues to decline. However, expectations were for a much bigger drop in the CPI year-over-year number from 3.4% to 2.9%. Instead, the CPI surprised to the upside with a 3.1% year-over-year print on the headline number. The monthly number was 0.3% versus the expected 0.2%. Rent prices have stayed stubbornly high and had a material impact on the monthly number.
Other analysts were quick to point out that January is a seasonal period and prone to a higher monthly number. That may or may not be true, but it offers a good explanation especially for TV market shows.
Given oil prices rising (and gasoline at the pump), grocery/food prices staying high, and other areas of the economy not slowing as expected, persistent inflation may be hard to knock down.
However, core CPI (ex-food and energy) is currently at 3.9% y/y and down significantly from last summer’s high of 6.6%. See chart below:

Core PPI (wholesale inflation) is at 2.0 y/y, also down from last year’s summer peak of 8.2%. So, the needle is moving more toward the green.
The latest Personal Consumption Expenditure (PCE) index (the Fed’s preferred inflation gauge) showed inflation at 3.2% y/y, down from last year’s peak of 5.3%
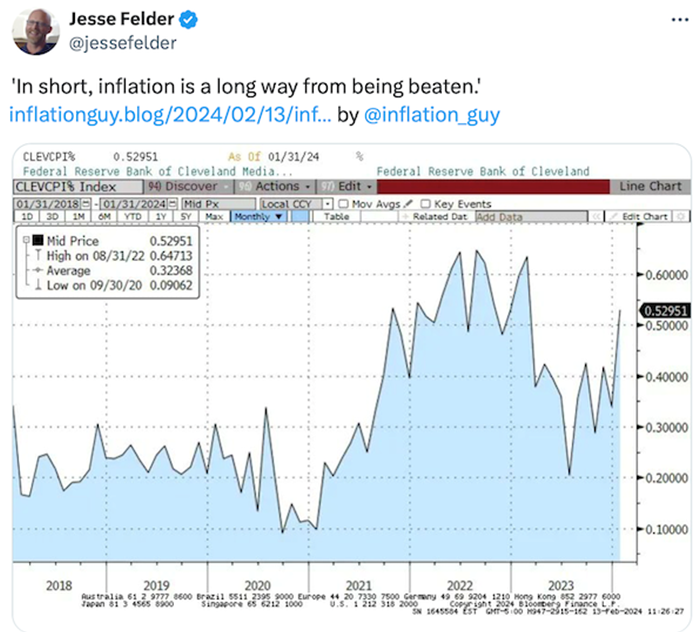
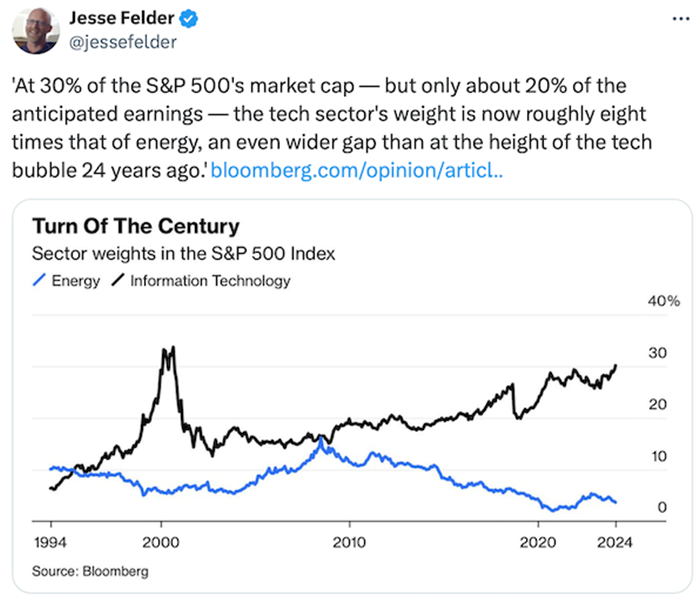
While it may be true that these inflation indicators ticked up due to a seasonal bias, the fact remains that we are a long way from the Fed’s targeted 2.0% inflation rate. Inflation, as we have pointed out on many occasions, will be hard to bring down to the Fed’s target rate. See the illustration below by fellow TalkMarkets Contributor, Jesse Felder:
Most of you are aware that the higher CPI number threw a monkey wrench into the markets on Tuesday, as we had the single biggest one-day decline since last March 2023. More importantly, interest rates continued rising this past week.
Rising interest rates typically have an impact on risk assets (as they did Tuesday) but thanks to the better-than-expected earnings reports that have been delivered these past few weeks during earnings season, the market’s resiliency has held up. Following the big decline on Tuesday, the markets moved higher on Wednesday and Thursday until Friday’s PPI report led to a down day to end the week.
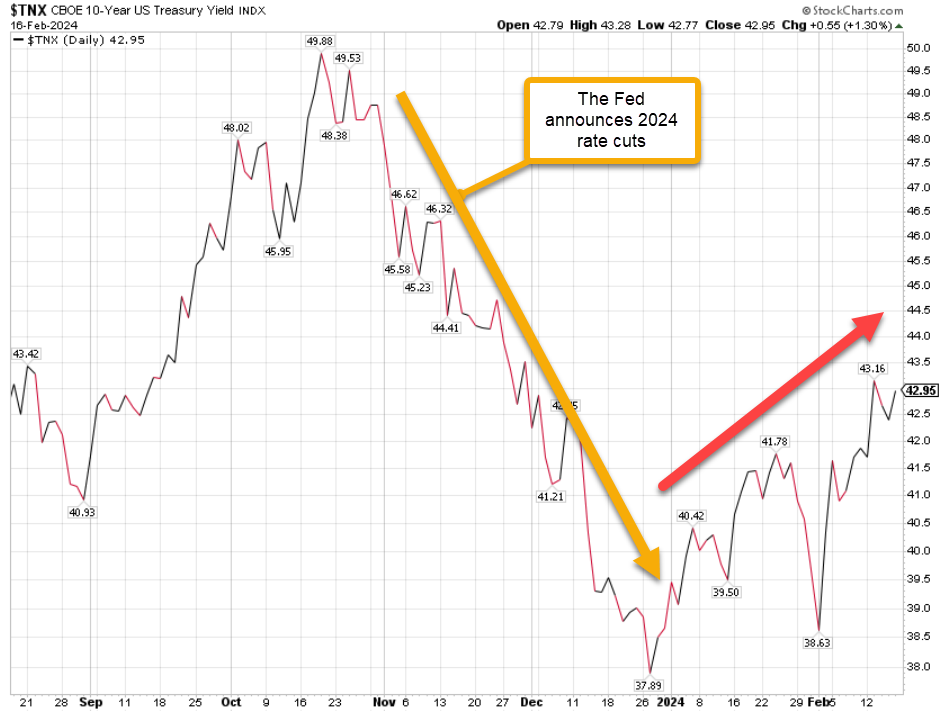
See the illustration below of the recent move higher in the 10-year interest rates.
While it's true that the recent CPI and PPI reports showed inflation falling a little bit less than expected, it's not likely to alter the Fed's thinking on rate cuts.
Those sentiments were echoed earlier this week by Austan Goolsbee, the President and CEO of the Federal Reserve Bank of Chicago, when he said what many in the market were already thinking, which is, "let's not get amped up on one month of CPI that was higher than it was expected to be." He continued by saying, "if you see inflation up a little bit, that doesn't mean that we're not on the target to get to 2%. We can still be on the path even if we have some increase and some ups and downs --- so let's not get too flipped out."
Last November, investors interpreted the Fed’s more dovish posture and immediately factored in as many as 6 rate cuts. We did not buy it. (we still don’t unless there is a major economic collapse). GDP growth is projected to stay positive during 2024. This would be consistent with the economic patterns that are typical in the 4th year of a Presidential cycle and especially during an election year. This would also mean that the US might possibly avert the dreaded Recession that many bond managers have been calling for (see Gundlach and Gross).
Additionally, earnings are growing at a higher rate than all the analysts’ and street’s expectations. This should be a positive contribution to bullish sentiment for stocks in 2024.
The interest rate projection for Fed rate cuts was recently altered after the January and February CPI/PPI releases. Most investors are now factoring in no more than 4 rate cuts and not beginning until June.
We would suggest that the Fed is between a rock and a hard place. If they are going to reduce the overnight Fed Funds rate, they probably should do it before June/July. The summer begins the Election cycle which includes the Political (DNC and RNC) conventions. I believe the Fed will try to refrain from the perception that it is meddling with the upcoming election.
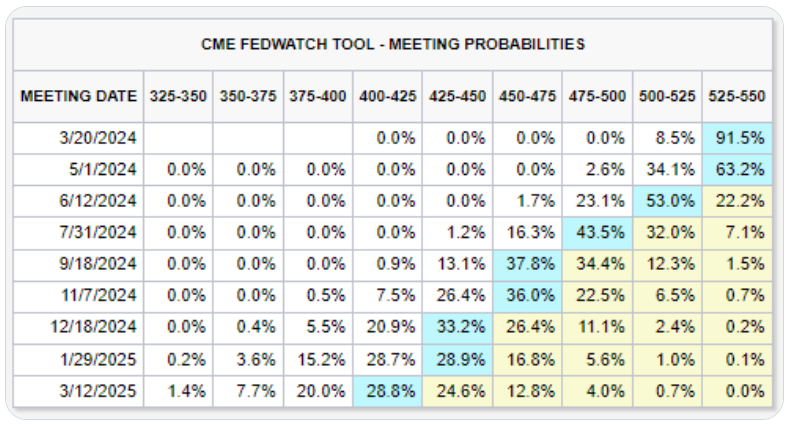
See the below commentary and graph that follows the % probabilities of the Fed lowering rates:
It's official, higher for longer is back: For the first time this year, markets are now pricing-in just 4 interest rate cuts in 2024. Just 6 weeks ago, markets were expecting 6 interest rate cuts in 2024. More importantly, the timing of the first rate cut has been pushed all the way back to June 2024. There is now only a 9% chance of rate cuts beginning in March 2024, down from 90% just 6 weeks ago. There is also a ~63% chance that interest rates are unchanged through May 2024. Rate cuts are all but guaranteed.
The Stock Market
Except for small-cap stocks (up 1.16% last week), the other major markets were all down, with the Dow (-0.14%) down for the second week in a row. The S&P 500 was down just slightly (0.34%). However, tech stocks had a rougher week, being down the most (-1.48%) as several mega-cap stocks incurred profit-taking. These included Apple, Microsoft, Amazon, and Google, which alone was down over 5% on the week.
In last week’s Market Outlook, we addressed several compelling reasons (along with illustrations) why we think small-cap stocks may be ripe for a healthy advance during 2024. We also commented on the recent breakout move in the IWM from its recent multi-month wedge. If you would like to go back and review the compelling reasons why small-caps stocks are attractive, click here to be taken to last week’s article.
Below is a table showing some of the large (and mega) cap stock winners and losers this past week:

"When you feel like bragging,
it's probably time to sell."
- John Neff
Are Technology stocks faltering?
I wouldn’t count technology stocks out yet as they certainly have the earnings power that could drive their prices higher. Several of our investment models are still positioned in technology stocks and specific sectors like Semiconductors.
For the moment, they could be taking a breather before heading higher. Perhaps they have gotten ahead of expectations for earnings in 2024, or maybe they need a healthy pullback before another bullish phase.
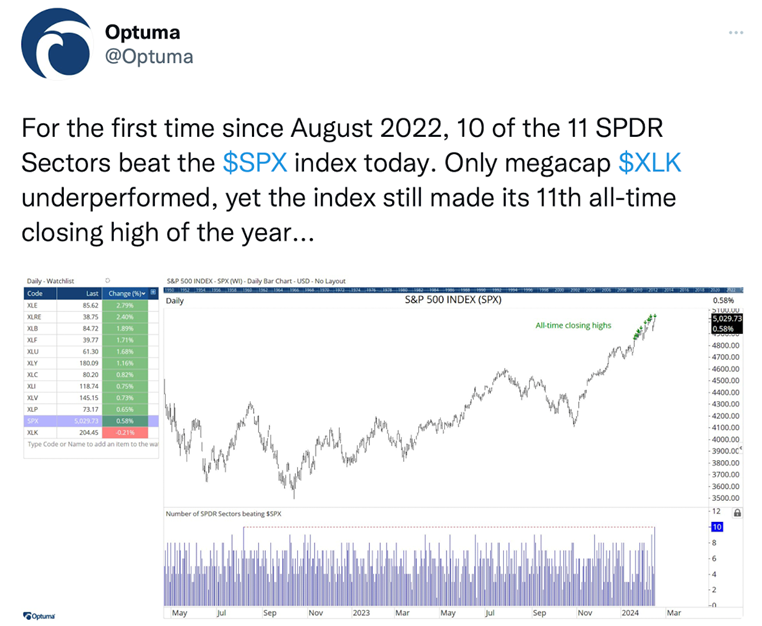
This past week, however, almost every other sector, many that had not gone anywhere for quite a while, all did better than tech. See chart below:
Recall that given most of the mega cap tech companies announcing the integration of AI into their products and innovation, technology stocks have soared during most of 2023 and so far in 2024. However, their influence and dominance in the overall market may be too large a % of the total (and casting a red flag to investors). See chart below:
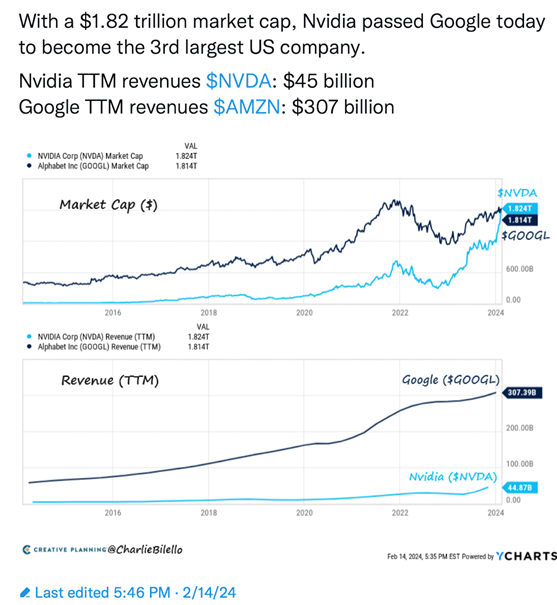
Interestingly, based on revenue Nvidia is a much smaller company than Google ($45 billion versus $307 billion). However, Friday the market cap valuation of Nvidia surpassed that of Google. This is due to AI and the perception by investors that this is the next GAME CHANGER. See the illustration below. (disregard the error that the chart shows AMZN when they meant GOOG).
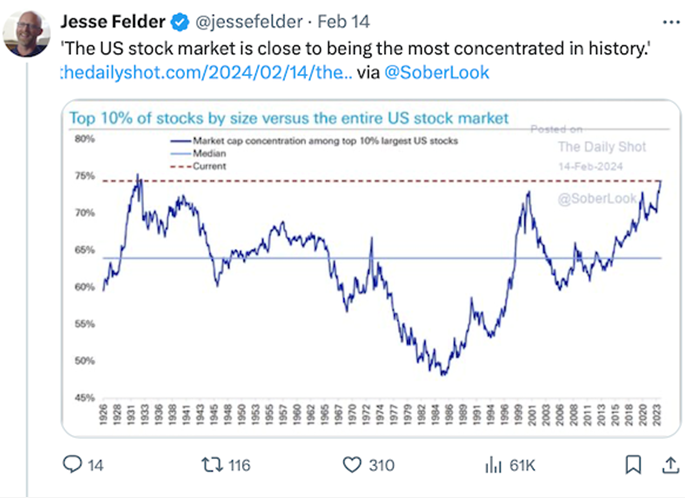
Many analysts are concerned that the market is over concentrated today. This is another red flag that hangs out there. Many investors believe that too few mega-cap stocks are influencing the overall stock market (and a cap-weighted index like the S&P 500). See chart below:
Value versus Growth Stocks.
This past week value stocks were up 0.80% (VTV) versus growth stocks (VUG) being down -1.31.
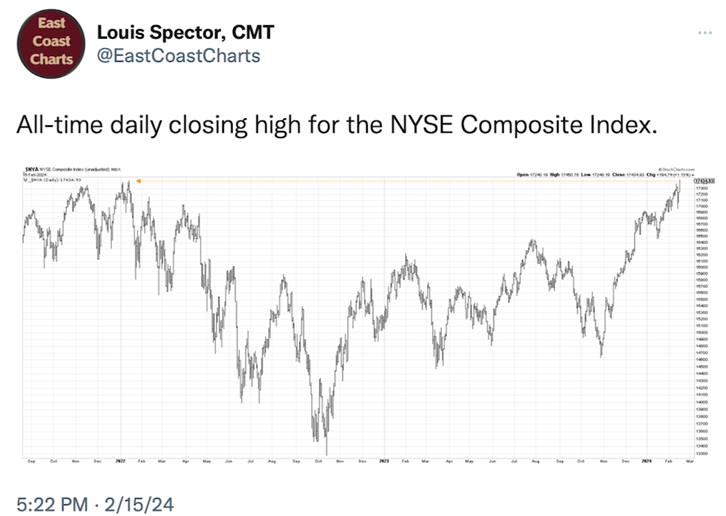
You may recall that since late December (2023) we have been suggesting you watch for a resurgence in value stocks (VTV) and small-cap stocks. Another positive sign that value stocks may be beginning to accelerate is the fact that the NYSE Composite, with more than 2,000 stocks (and many of the largest financial stocks that are more Value oriented), made a new all-time high this week. This was after stalling for two years beginning in early 2022. See below:
One of my late 2023 predictions made back in December was that I felt Healthcare stocks would be one of the better sectors to invest in for 2024. Many healthcare stocks are listed in the NYSE Composite Index. These stocks are also more value-based companies selling at reasonable valuations (P/E & P/B). Rotation into these companies has accelerated these past few weeks. See chart below by fellow TalkMarkets Contributor, Justin Spittler:

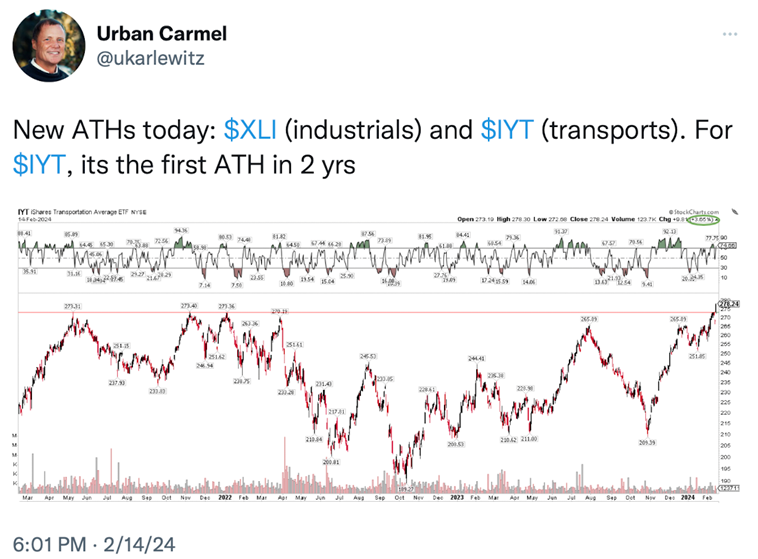
Another positive development for the markets (and Value stocks) is that the Transportation and Industrial sectors recently hit new all-time highs. Both sectors have older, slower growing companies that are important to our overall economy and to growth (GDP).
These recent highs bode well for the overall market (especially transportation stocks, which reinforce the Dow Theory to confirm the recent ATH of the Dow Jones) and should put some momentum in undervalued - value stocks to make a move higher. See chart below:
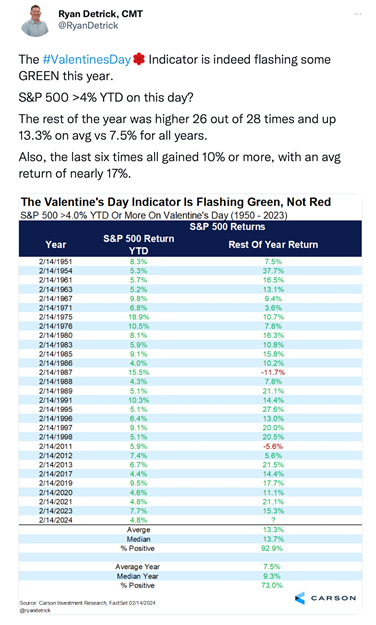
The S&P 500 is currently up 4.8% year-to-date. Historically the next few weeks have been bearish (until St. Patty’s Day). However, in the spirit of Valentine’s Day, Ryan Detrick of the Carson Group (one of our favorite market technicians) gives the bulls a reason to love the market.

The Valentine’s Day Indicator
- When the S&P 500 has been up more than 4% by Valentine’s Day, the year has finished positive 93% of the time for an average gain of 13.3%. That’s almost 2x better than the average annual gain of 7.5%.
- “The Valentine’s Day Indicator” as Ryan calls it, has been even stronger than usual recently. The past six times have all finished up more than +10% for an impressive average gain of 17% See the indicator below:
Thanks for “tuning in” this week. Hope you find some of the information and charts useful.
More By This Author:
Small Caps Clear A Path For Higher Prices
Did Small Caps Suffer Near-Term Irreparable Damage?
Year Of The Dragon - Will Vietnam ETF Breathe Fire?

Comments
Log in or sign up to join the conversation.