
Peek Into Future Through Futures: How Hedge Funds Are Positioned - Sunday, November 3
Following futures positions of non-commercials are as of October 29, 2019.
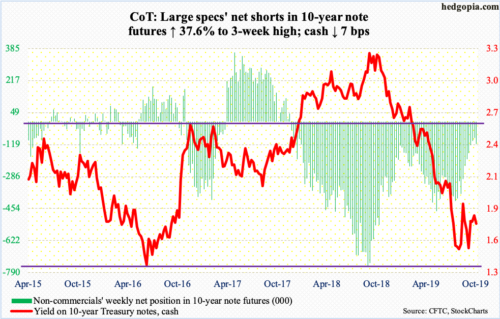
10-year note: Currently net short 116.1k, up 31.7k.
As expected, the FOMC delivered a 25-basis-point cut in the fed funds rate this week. This was a third straight cut since July for a cumulative reduction of 75 basis points. The policy rate is at a range of 150 to 175 basis points. The Fed’s monetary quiver lacks sufficient arrows. With post-Great Recession recovery/expansion in its 11th year, the US economy is showing signs of wear and tear – holding up but in deceleration.
The Fed likely pauses. Jerome Powell, chair, said it will take material change in outlook to justify further rate cut. That said, “policy is not on a preset course.” Markets do not expect a cut either. In the futures market, odds of a quarter-point cut in December are currently 13 percent. This rises to just north of 50 percent by April next year.
With less ammunition at their disposal, Powell and the team will be tested should the economy continue to decelerate. Their best hope is that the three rate cuts this year will begin to reverberate through the economy in a positive manner. But the fact remains that (1) the recovery is long in its tooth, and (2) rates are already so low they may not be of much help, particularly when it comes to corporate capex decisions. Unless, of course, it is different this time.
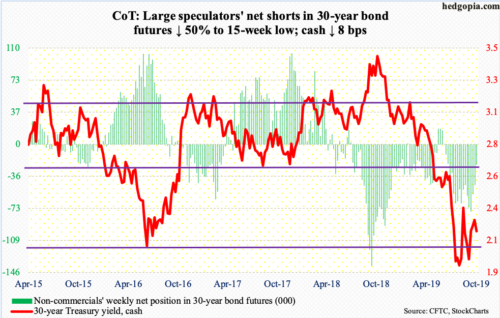
30-year bond: Currently net short 23.1k, down 23.1k.
Major economic releases next week are as follows.
Revised durable goods data come out Monday (September). Preliminarily, orders for non-defense capital goods ex-aircraft – proxy for business capex plans – dropped 0.8 percent year-over-year to a seasonally adjusted annual rate of $68.6 billion. This was the third straight y/y drop.
Tuesday, the ISM non-manufacturing index (October) and job openings (September) are due out.
Services activity fell 3.8 points month-over-month in September to 52.6 – a three-year low.
Non-farm job openings (JOLTS) in August dropped 123,000 m/m 7.1 million. Openings peaked at 7.6 million last November.
Labor productivity (3Q19) is on schedule Wednesday. In 2Q, output per hour rose 1.8 percent y/y. This was a four-year high – shows how suppressed productivity has been in this cycle.
Friday brings the University of Michigan’s consumer sentiment index (November, preliminary). October rose 2.3 points m/m to 95.5. Except for August’s 89.8, sentiment has been north of 90 – four of them 100 or higher – since November 2016.
WTI crude oil: Currently net long 532.2k, up 19.7k.
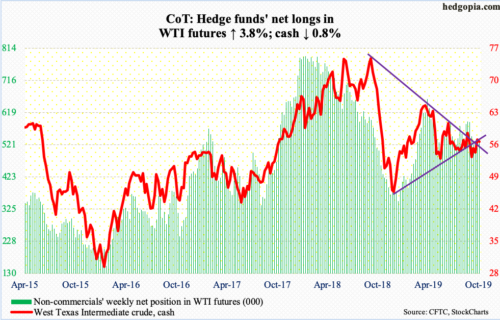
In the week to October 25, US crude producers continued to pump 12.6 million barrels per day. This was the fourth straight week of record production. In the same week, as per the EIA, crude imports rose 840,000 bpd to 6.7 mbpd. Crude stocks increased as well, up 5.7 million barrels to 438.9 million barrels. Stocks of gasoline and distillate, however, fell by three million barrels and one million barrels respectively to 220.1 million barrels and 119.8 million barrels. Refinery utilization rose 2.5 percentage points to 87.7 percent.
The cash ($56.20/barrel) opened the week with a test of the 200-day moving average ($57.17) and was denied. By Wednesday, it also lost the 50-day ($55.37), which was then recaptured in Friday’s 3.7-percent, post-jobs report rally. Friday’s action pushes the crude back above a falling trend line from last October when it peaked at $76.90. It is currently sandwiched between the averages. Both are kind of flattish.
E-mini S&P 500: Currently net long 33.5k, up 10.3k.
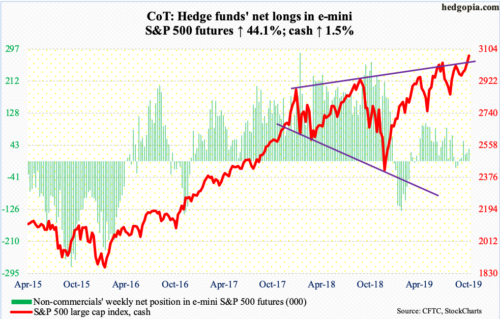
In the week through Wednesday, SPY (SPDR S&P 500 ETF), VOO (Vanguard S&P 500 ETF) and IVV (iShares Core S&P 500 ETF) bled a combined $2.7 billion (courtesy of ETF.com). US-based equity funds in the same week, on the other hand, gained $633 million (courtesy of Lipper). In the meantime, money-market assets continued higher, up $27.3 billion to $3.5 trillion, which was the highest since September 2009 (courtesy of ICI).
Monday, the cash (3066.91) printed a new high. The streak continued all week except for Thursday, with Friday’s close essentially at the session’s intraday high. The S&P 500 remains grossly overbought – particularly on the daily – but the fact remains that both Thursday and Friday bulls defended breakout retest at 3020s. Immediately ahead, support lies at 3050.
Euro: Currently net short 53.4k, up 2.3k.
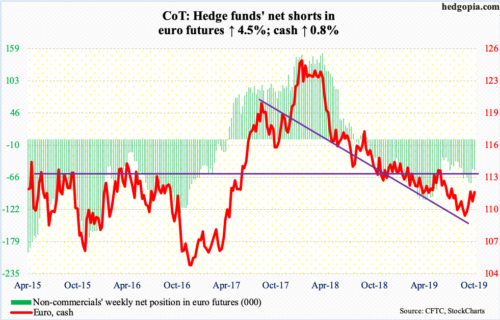
Last Friday’s intraday low of $110.73 was successfully tested both Tuesday and Wednesday this week before the cash ($111.66) pushed higher. That said, it is yet to decisively take out last week’s high of $111.74. Once that occurs, the 200-day ($112.03) will be the next test.
Gold: Currently net long 276.5k, up 17.4k.
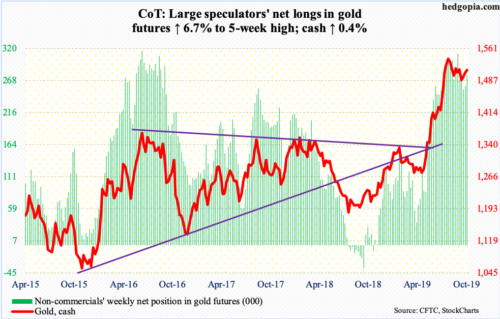
Intraday Wednesday, the cash ($1,511.40/ounce) lost a slightly-rising trend line from early October but the support was saved by close. By Thursday, gold bugs broke out of a falling trend line from September 4 when gold peaked $1,566.20. The 50-day lies at $1,511.05. Daily Bollinger bands have narrowed to a point in which they could soon begin to expand. In this scenario, a sharp move could arrive soon – either up or down. The way the metal is holding support and hammering on resistance, bulls have the advantage.
Immediately ahead, resistance lies at $1,540s-50s. All the way going back to September 2011, gold peaked at record $1,923.70 and began to unravel after it lost $1,540s-50s. Plus, a 61.8-percent Fibonacci retracement of the September 2011-December 2015 decline lies at $1,588.
In the week to Wednesday, GLD (SPDR Gold ETF) lost $140 million, while IAU (iShares Gold Trust) gained $34 million (courtesy of ETF.com).
Nasdaq 100 index (mini): Currently net long 40.4k, up 9.3k.
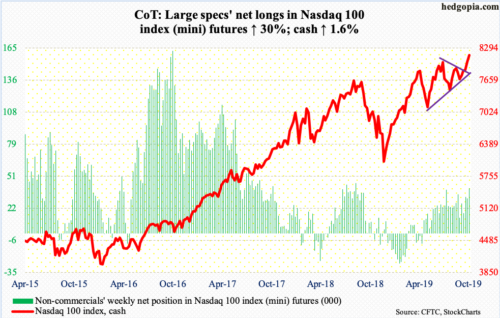
Bulls further pressed this week with results from both Apple (AAPL) and Facebook (FB) drawing positive reaction on Thursday. In the week through Wednesday, QQQ (Invesco QQQ Trust) drew $981 million (courtesy of ETF.com); in the last four weeks, flows have alternated between losses and gains.
Monday, the cash (8161.17) reached a new intraday high of 8119.79. The prior high of 8027.18 was from July this year. On Wednesday and Thursday, bids showed up near that high, which helped create the upward pressure evident on Friday when the Nasdaq 100 rallied one percent.
The daily is ridiculously overbought, but bulls continue to hold the momentum ball, with shorter-term averages continuing to rise.
Russell 2000 mini-index: Currently net short 15.7k, down 11.4k.
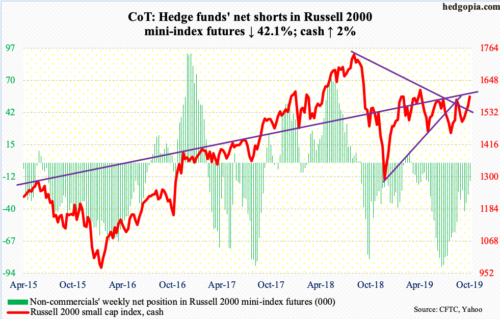
In the week to Wednesday, $183 million came out of IWM (iShares Russell 2000 ETF), even as IJR (iShares Core S&P Small-Cap ETF) gained $97 million (courtesy of ETF.com).
The cash (1589.33) broke through a falling trend line from August last year when it peaked at 1742.09. This opens the door to a test of 1600, where bulls have been rejected several times. This ceiling goes back to January last year.
US Dollar Index: Currently net long 29.5k, down 1.7k.
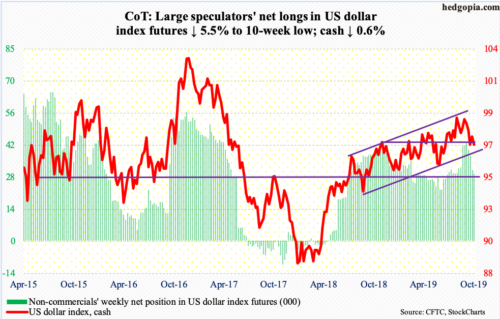
Several times this week, dollar bulls were denied at 97.50s. By Friday, the cash (97.04) was pushed under the 200-day (97.15). Support at a 15-month ascending channel rests at 96.50. Should a breach occur, horizontal support lies north of 95.
VIX: Currently net short 187.9k, up 16.7k.
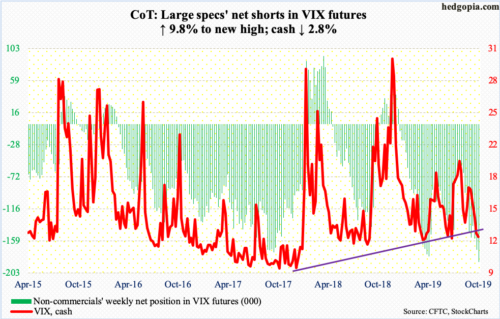
The cash (12.30) continued to face resistance at the 10-day. Thursday, VIX made an intraday low of 12.19. Non-commercials, who this week raised net shorts in VIX futures to a new record, are acting as if the cash continues lower. Since April last year, VIX has not broken 10-11. Its all-time low of 8.56 was recorded in November 2017.
Medium- to long-term, these massive net shorts are a recipe for a spike in the cash as these traders cover, or are forced to cover. In the past, the cash has tended to peak as non-commercials either go net long or substantially reduce their net shorts.
In the meantime, the CBOE equity-only put-to-call ratio printed 0.53 Friday. This was a fourth 0.50s reading in the past six sessions. The 21-day moving average of the ratio ended the week at 0.649, down from 0.699 on October 18. If past is prologue, it can continue to unwind until it hits high 0.50s to low 0.60s, before going the other way. On September 24, it bottomed at 0.632, with the S&P 500 coming under pressure into early October.


