
Peek Into Future Through Futures, How Hedge Funds Are Positioned As Of June 15
Following futures positions of non-commercials are as of June 15, 2021.
10-year note: Currently net long 34.3k, down 139.1k.
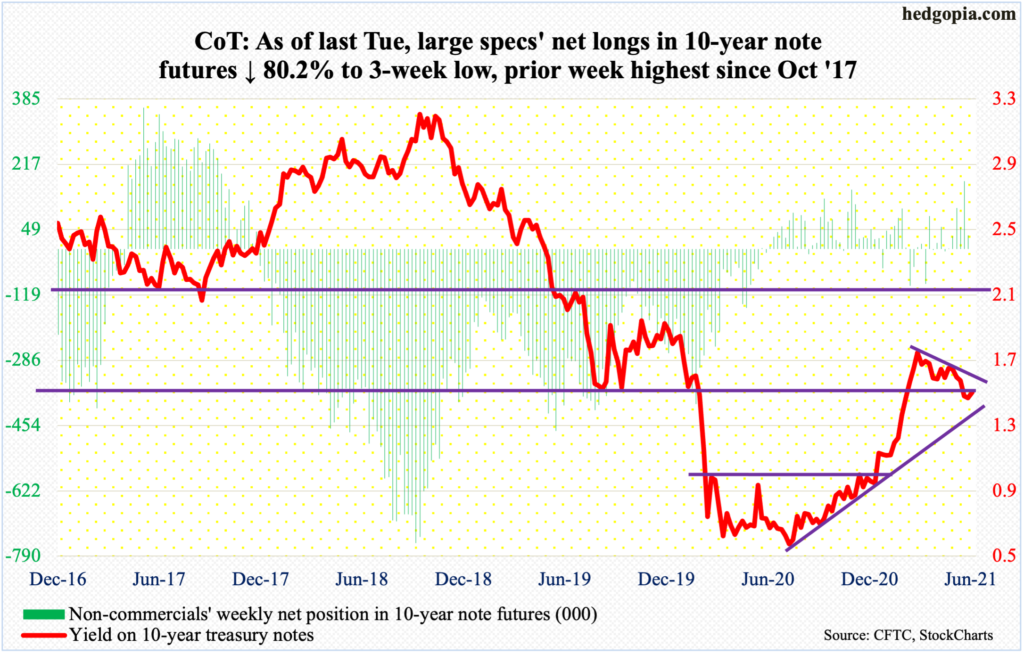
Last week’s FOMC meeting pulled a surprise on markets. Members brought forward their projections for interest rate hikes into 2023, with 11 of them penciling in at least two quarter-point increases for 2023.
Since the slight hawkish tilt was not expected, repercussions were felt across assets. Equities were sold, long rates rose, the dollar was bid up and gold tumbled, among others.
We are talking two rate hikes from essentially zero. And the planned hikes are still two years away. But at this juncture, it is not the magnitude that matters, it is the message. Sentiment is beginning to shift.
The recent upward pressure on inflation may have something to do with it, or the sheer size of asset accumulation. The Fed spends up to $120 billion a month in bond purchases – $80 billion in treasury notes and bonds and $40 billion in mortgage-backed securities. The balance sheet has grown from $4.24 trillion in early March last year to $8.06 trillion!
The decision to aggressively expand its asset base was easy. Getting out of it will not be. Last week’s adverse reaction in the markets most probably is only a trailer of a horror movie that is yet to hit theaters.
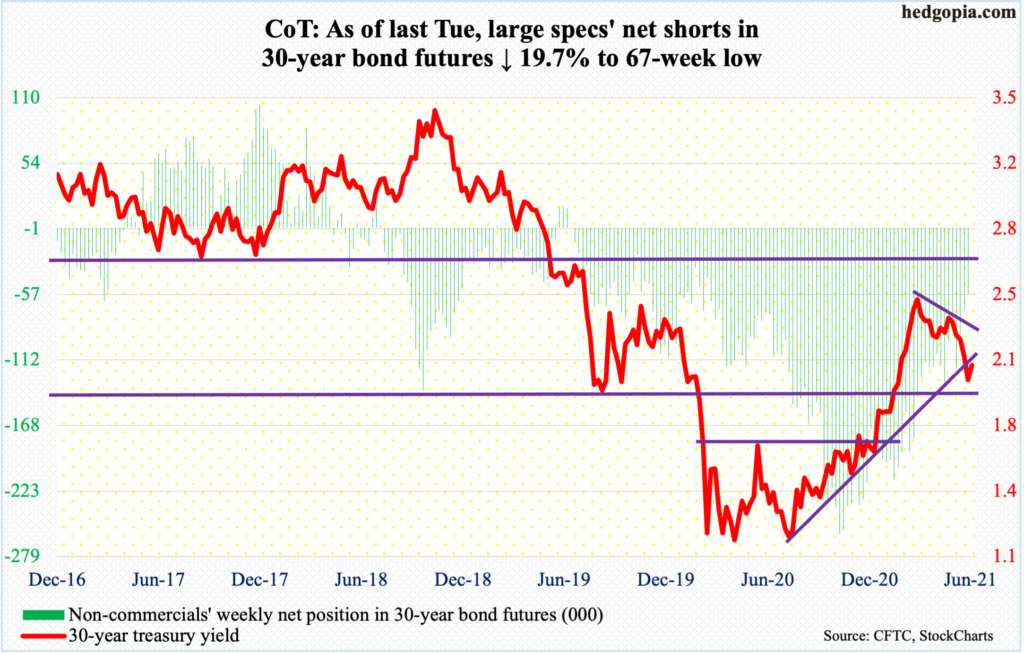
30-year bond: Currently net short 56.7k, down 13.9k.
Major economic releases for the remainder of the week are as follows.
Existing home sales (May) will be published later this morning. Sales in April dropped 2.7 percent month-over-month to a seasonally adjusted annual rate of 5.85 million units. Last October, sales hit 6.73 million, having earlier reached the post-pandemic low of 4.01 million in May last year.
New home sales (May) are due out on Wednesday. April sales were down 5.9 percent m/m to 863,000 units (SAAR). Earlier in January, sales hit 993,000 units, which were the highest since December 2006.
Thursday has on deck durable goods orders (May), GDP (1Q21, final estimate), and corporate profits (1Q21, final).
The second estimate showed real GDP in 1Q21 grew at an annual rate of 6.4 percent.
Corporate profits adjusted for inventory valuation and capital consumption were unchanged sequentially in 1Q21 at $2.29 trillion (SAAR). In 3Q20, profits peaked at $2.33 trillion.
Personal income/spending (May) and the University of Michigan’s consumer sentiment index (June, final) will be out on Friday.
In the 12 months to April, core PCE, which is the Fed’s favorite measure of consumer inflation, jumped 3.1 percent – the fastest y/y pace since July 1992.
Preliminarily in June, consumer sentiment rose 3.5 points m/m 86.4. Survey respondents expected four percent inflation next year and 2.8 percent in the next five years, downshifting from May’s 4.6 percent and three percent respectively.
WTI crude oil: Currently net long 573.5k, up 13k.
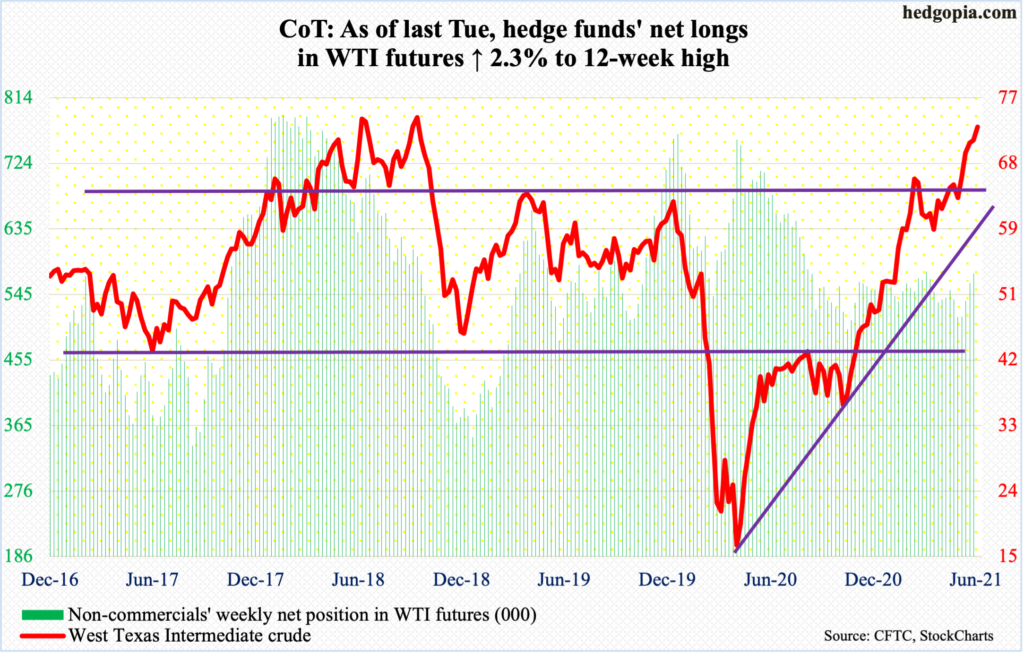
Last week, WTI ($73.12/barrel) printed $72.99 intraday Wednesday before reversing in a spinning top session. This was surpassed Monday (this week) as the crude ticked $73.28 intraday. This is the most expensive oil price since October 2018 when WTI reversed sharply lower after ticking $76.90. This level – or $75 – is well within reach.
Conditions remain grossly overbought. In April last year, WTI bottomed at $6.50, subsequently taking out one after another resistance. Early this month, it broke out of $66-$67, which bulls and bears have fought over dating back to 2006. In the event of a pullback, this is where a duel is set to occur.
E-mini S&P 500: Currently net short 16.7k, up 2k.
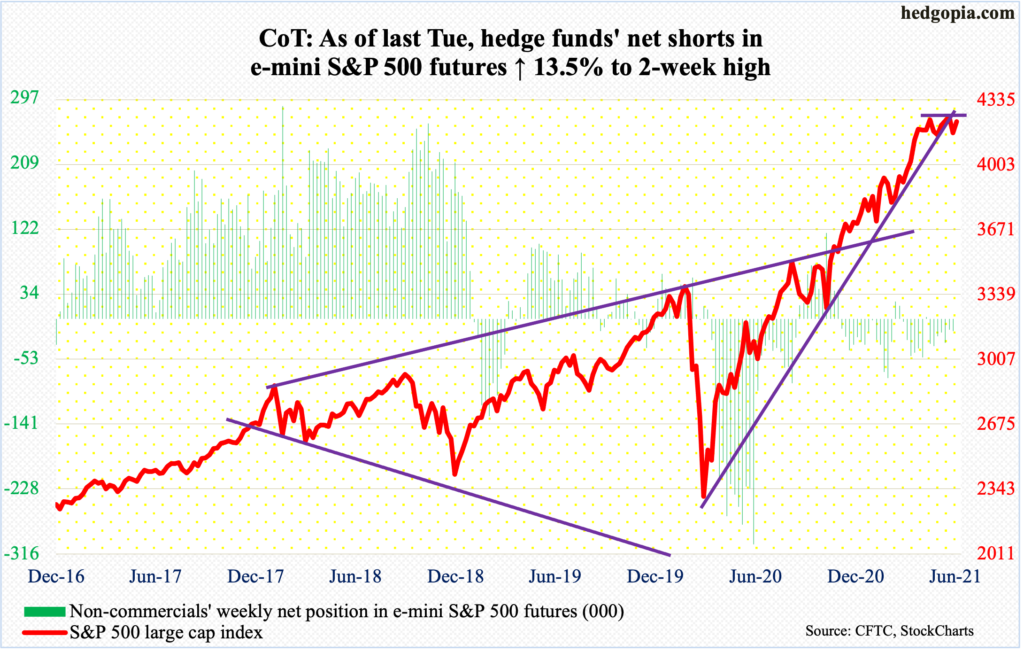
Equity bulls sought to break out of 4230s-40s but ran out of fuel. Last Tuesday’s new all-time high of 4257 surpassed the prior week’s high, but merely by 7.42 points (more on this here). Sellers showed up just under the daily upper Bollinger band. By Friday, the 50-day was breached but the lower Bollinger band held.
Importantly, since May last year, the average has been tested several times – successfully; there were a few breaches but were not lasting. The most recent test took place last month when on the 19th in particular buyers showed up just under the average for a hammer reversal.
Once again, bulls put their foot down near the average, with the S&P 500 (4225) up 1.4 percent on Monday. The aforementioned resistance is in play – again.
Euro: Currently net long 118.2k, up 11k.
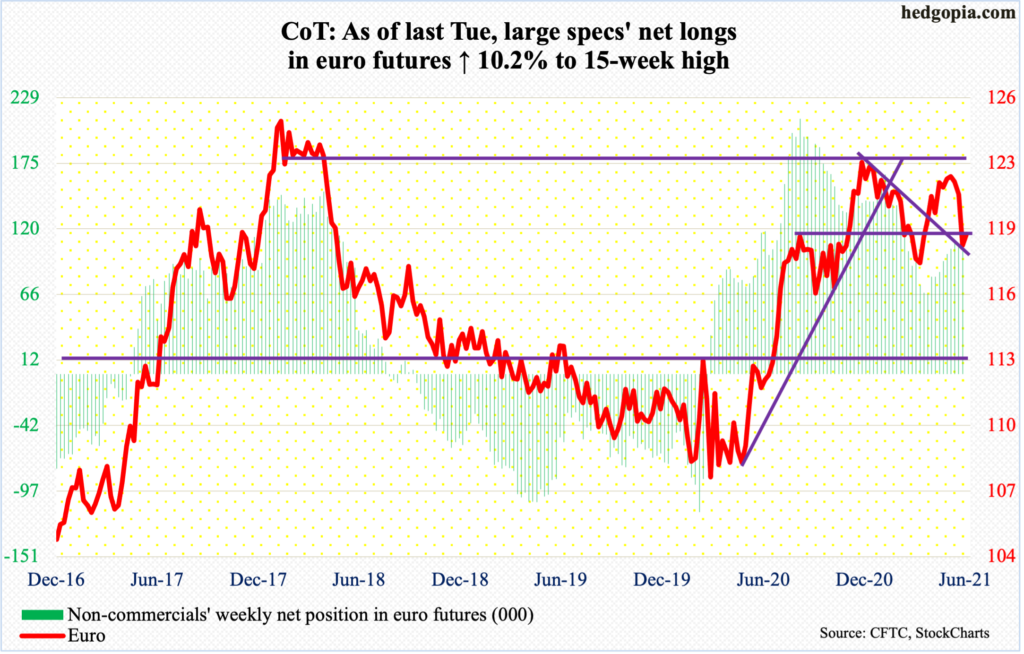
The euro ($1.1917) broke down last week. Wednesday’s breach of the 50-day was followed by a gap-down breach of the 200-day on Thursday, followed by the loss of a rising trend line from March last year when the currency bottomed at $1.0635. For the week, it shed two percent.
Earlier in a spinning top session on May 25, the euro posted a lower high of $1.2267 versus $1.2345 on January 6.
Crucial horizontal support at $1.19-$1.20, which goes back 18 years, was compromised last week. Monday’s 0.5-percent rally pushes the currency back into the zone, with a confluence of resistance around $1.20. The underside of the aforementioned broken trend line extends to just under that level. The 200-day lies at $1.1990, and last Thursday’s gap-down gets filled just under $1.20.
Gold: Currently net long 192k, down 17.4k.
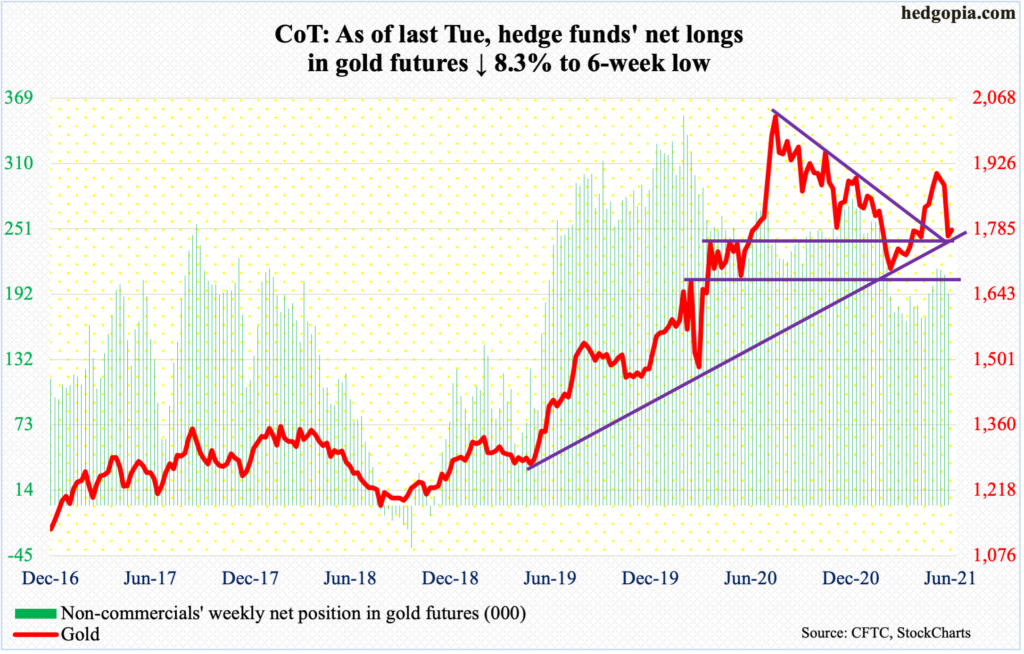
After failing at $1,920s several times this month, gold ($1,782.90/ounce) came undone last week, particularly on Thursday when it collapsed 4.7 percent, slicing through both the 50- and 200-day. The metal closed out Friday right on $1,760s-$1,770s, which it broke out of early last month.
Gold bottomed at $1,670s in March before rallying to eventually test $1,920s. In September 2011, the yellow metal peaked at $1,920s, before coming under pressure to eventually bottom at $1,045 in December 2015.
Gold bugs lost $1,920s last November. Recapturing of the level at the very first try was not easy but gold bugs need to be able to defend support – preferably $1,760s-$1,770s and $1,670s at worse.
So far so good. On Monday, the metal rallied 0.8 percent. Last Friday, it ticked $1,761.20 intraday. The daily is oversold. Nearest resistance lies at $1,800, followed by the 50- and 200-day ($1,830 and $1,841 respectively).
Nasdaq 100 index (mini): Currently net short 11k, up 2.5k.
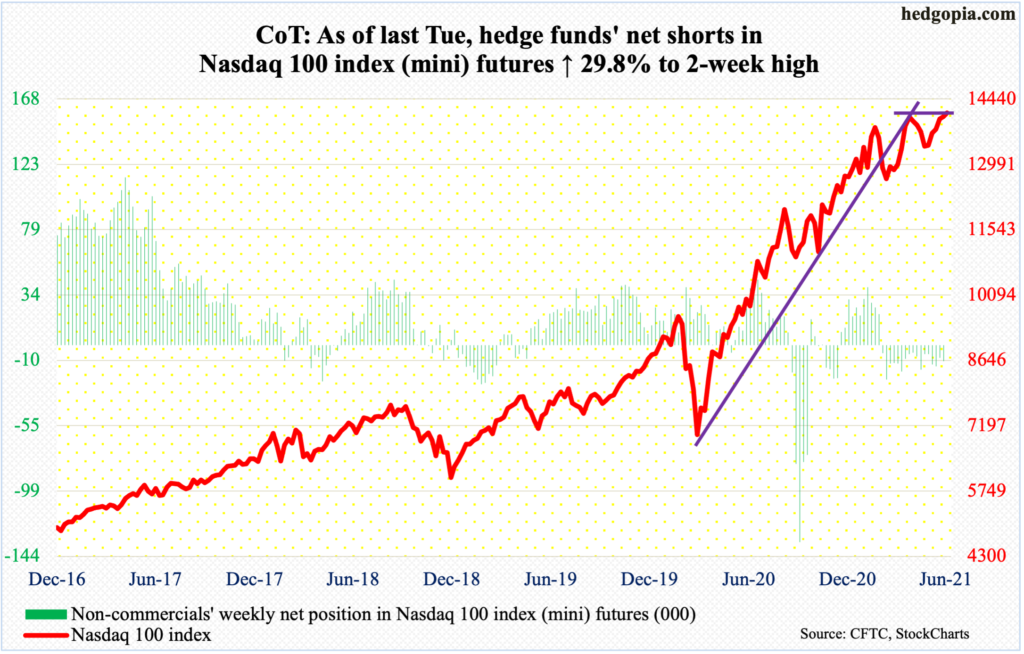
Despite a volatile Tuesday and Wednesday last week, the Nasdaq 100 managed to save Monday’s rather meek breakout past 14000, but barely. On Monday, the index (14137) rallied 0.6 percent.
Tech bulls should find this encouraging given one after another potentially bearish monthly candle this year.
January produced a long-legged doji, February a dragonfly doji, and March a gravestone doji; April’s 5.9-percent rally tried to neutralize these candles, but May, down 1.3 percent, formed a hanging man. June so far is up 3.3 percent.
Of note, a rising trend line from the low of March last year was breached in February. Another trend line drawn from that low joining the two weekly lows (not close) of March is intact, with bids showing up right on that support the last four weeks. It bodes well if the technically oriented ones are giving more currency to this trend line than the first one.
Russell 2000 mini-index: Currently net short 50k, up 6.6k.
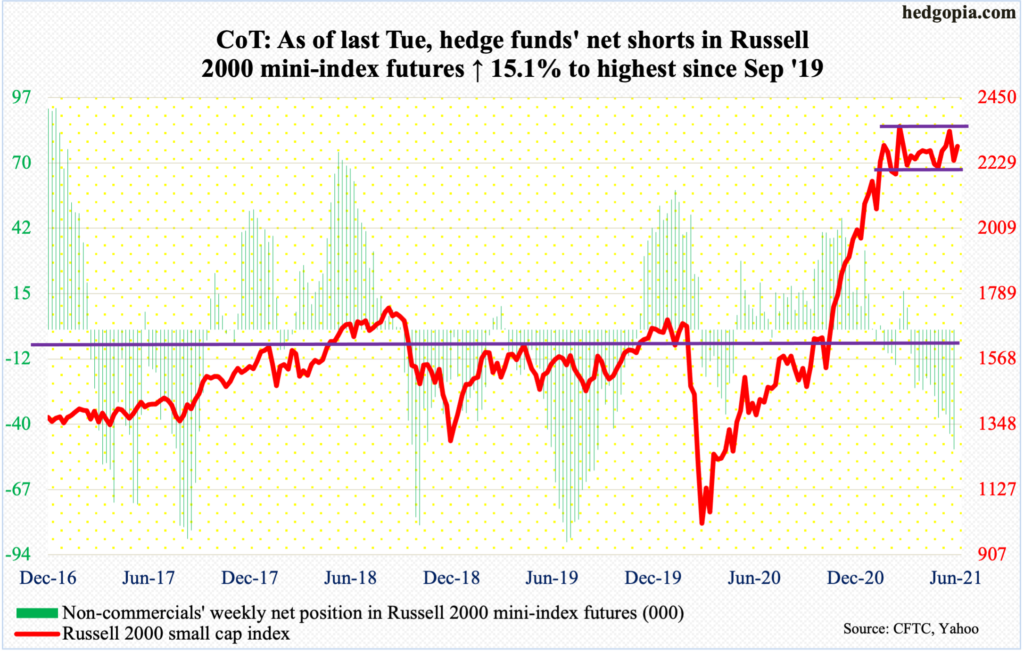
Going into last week, small-cap bulls were staring into a big opportunity to squeeze shorts but came up short.
Last week, the Russell 2000 looked to be on the verge of a breakout, having come within less than 10 points of its all-time high of 2360 posted on March 15. This was taking place even as non-commercials were sitting on net shorts that were the highest since September 2019 and IWM short interest as of mid-May was the highest since September 2015.
However, last Monday’s rally attempt was quickly sold, and this was followed by persistent selling in the next four sessions, with Friday breaching the 50-day. The average was recaptured on Monday (this week) when the index rallied 2.2 percent to finish right on 2280s resistance.
Short squeeze is possible should 2350s-60s decisively give way.
US Dollar Index: Currently net short 2.3k, up 4.1k.
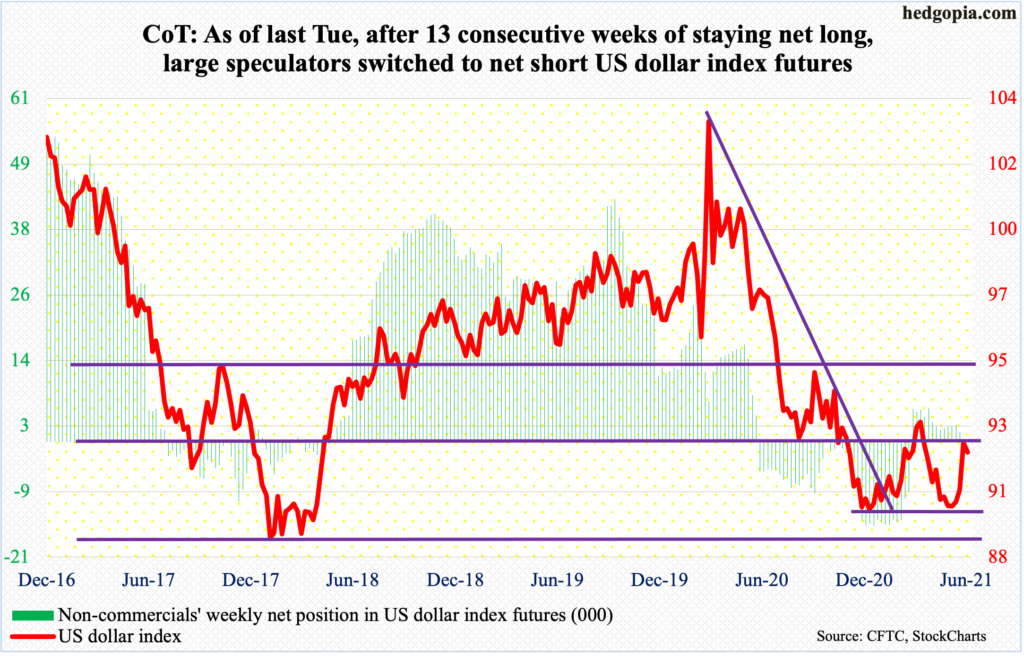
After sluggish, sideways action for a month and a half, the US dollar index suddenly came to life last week, rallying 1.8 percent and hurriedly reclaiming both the 50- and 200-day.
Ahead of this, the index (91.88) dropped as low as 89.17 on January 6. Support at 88-89 goes back at least 17 years. On May 25, a higher low of 89.52 was set, followed by another higher low of 89.83 on the 9th this month.
Last November, crucial support just north of 92 was compromised. In March, dollar bulls recaptured the level, rallying the index to 93.47 but that proved fleeting. Last Friday, the index rallied as high as 92.40, and it looks like they will have to wait for another day before a breakout occurs. The most recent rally has pushed the index into overbought territory, and there is plenty of room for unwinding.
VIX: Currently net short 68.7k, up 6.6k.
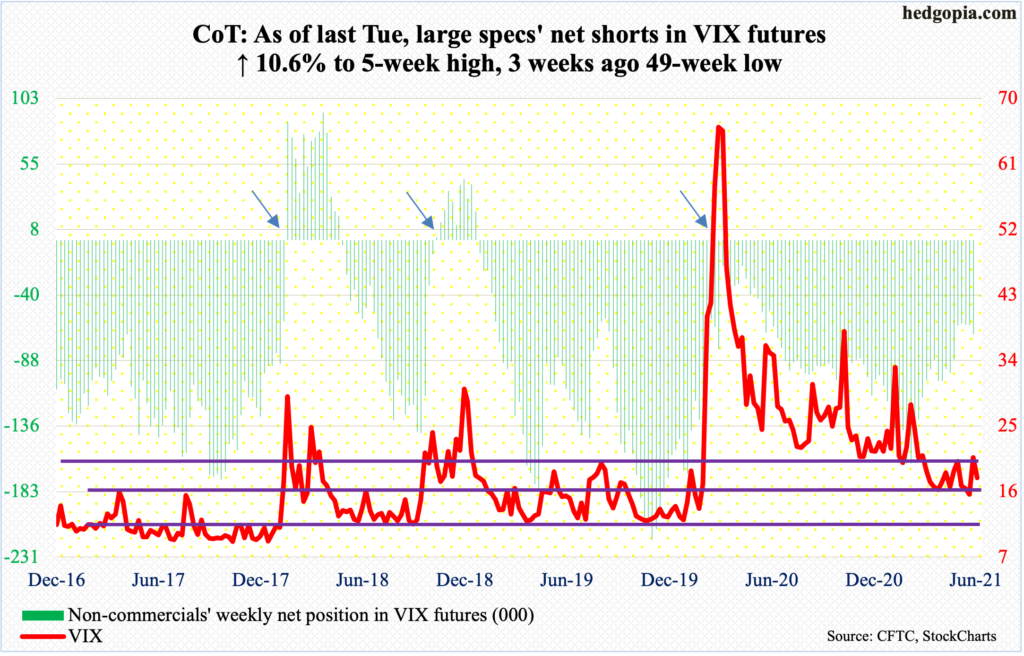
Before last week’s 16.6-percent jump, VIX doggedly held 15 for two months. Last Monday, the volatility index ticked 15.04 in a spinning top session, slightly undercutting the lows of 15.38 (April 14) and 15.15 (June 8).
Last Friday, the 50-day was reclaimed, closing out the week at the low-20s. This week began with an attempt to rally, with a daily high of 21.82, but only to reverse sharply lower to close at 17.89.
For sustained momentum, VIX needs to break a pattern of lower highs in place since it peaked at 85.47 in March last year. Its most recent high was set at 25.96 on May 19; Monday marks yet another lower high.
Disclaimer: This article is not intended to be, nor shall it be construed as investment advice. Neither the information nor any opinion expressed here constitutes an offer to buy or sell any ...
more

