
Or, Why We Don’t Use GDP Alone to Determine Business Cycle Dates. First, consider our various measures of output.
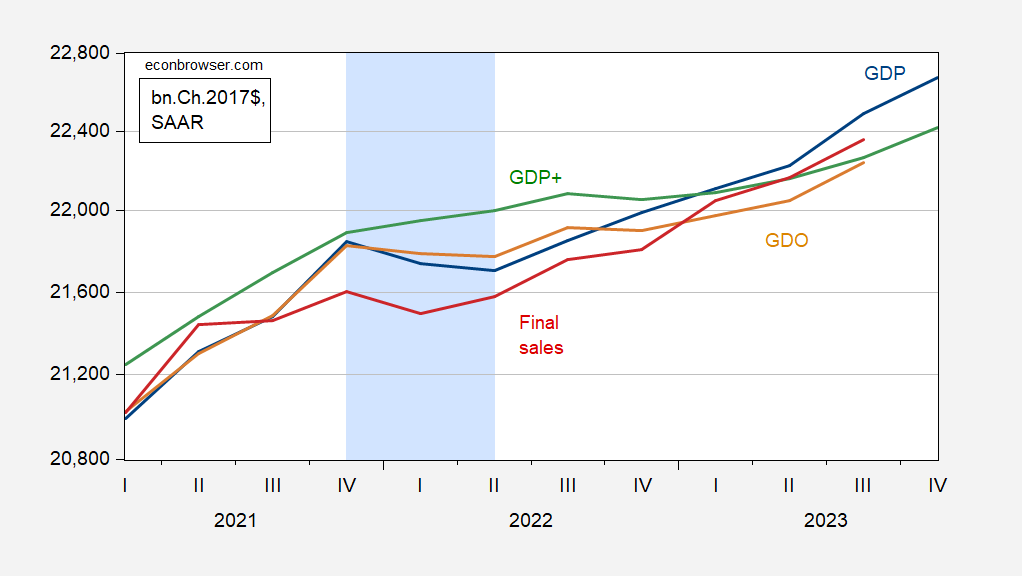
Figure 1: GDP (blue), GDO (tan), and GDP+ (green), final sales (red), all in bn.Ch.2017$ SAAR.GDP+ assumes 2019Q4 GDP+ equals GDP. Hypothesized 2022H1 recession shaded light blue. Source: BEA 2023Q4 advance estimate, Philadelphia Fed, and author’s calculations.
While GDP and GDO decline in 2022H1, GDP+ which is aimed to hitting the eventual level of GDP grows consistently over the 2022H1. Final sales (GDP ex-inventory accumulation) only shows one quarter of decline. I might note that GDO in 2022Q2 is only 0.26 percentage points below 2021Q4 levels…
Second, consider other — more timely — measures of economic activity. NBER’s Business Cycle Dating Committee relies upon a series of variables, chief among them in recent times nonfarm payroll employment and personal income excluding current transfers. These are shown in Figure 2 below, with monthly GDP and official quarterly GDP added in.
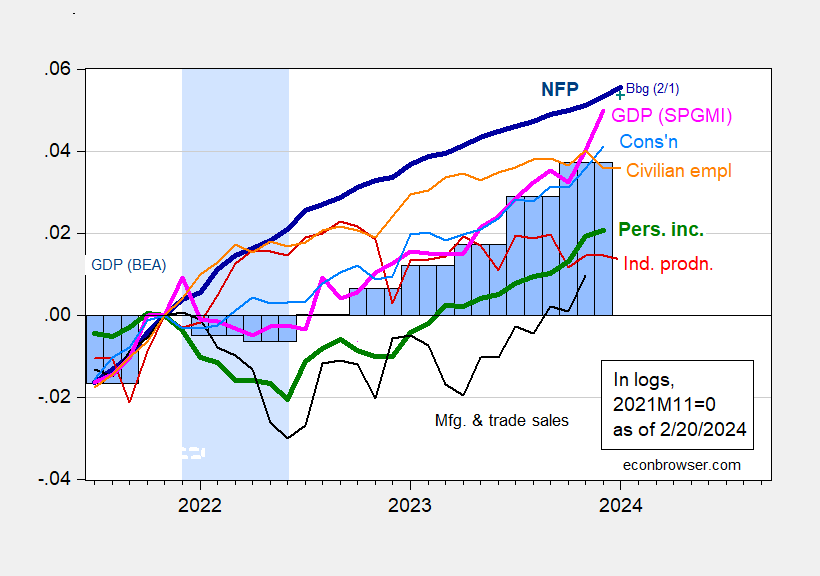
Figure 2: Nonfarm Payroll employment (bold dark blue), Bloomberg consensus of 2/1 (blue +), civilian employment (orange), industrial production (red), personal income excluding current transfers in Ch.2017$ (bold green), manufacturing and trade sales in Ch.2017$ (black), consumption in Ch.2017$ (light blue), and monthly GDP in Ch.2017$ (pink), GDP, 2023Q4 advance release (blue bars), all log normalized to 2021M11=0. Hypothesized 2022H1 recession shaded light blue. Source: BEA, BLS via FRED, Federal Reserve, 2023Q4 advance release,, S&P Global Market Insights (nee Macroeconomic Advisers, IHS Markit) (2/1/2024 release), and author’s calculations.
It’s hard to make out a consistent story with different variables going different directions. One way to circumvent this problem is to summarize the information in these series in one series. A principal component analysis is one approach, as suggested by Atkinson et al. at the Dallas Fed (2022). Figure 3 shows the first principal component of the above series (ex-monthly GDP, and official GDP).

Figure 3: First principal component of nonfarm payroll employment, industrial production, personal income ex-current transfers, manufacturing and trade industry sales, consumption, civilian employment in logs, 2007M01-2023M11. Hypothesized 2022H1 recession shaded light blue. Source: author’s calculations.
Philadelphia Fed calculates a coincident index for states and the United States overall, which is based primarily on labor market data. This series is shown in Figure 4 below as the consistently rising series in blue. Relatedly, one possibility is to examine a geographically-defined diffusion index, based on the Philadelphia Fed’s coincident indexes, as suggested by Picerno (2024).
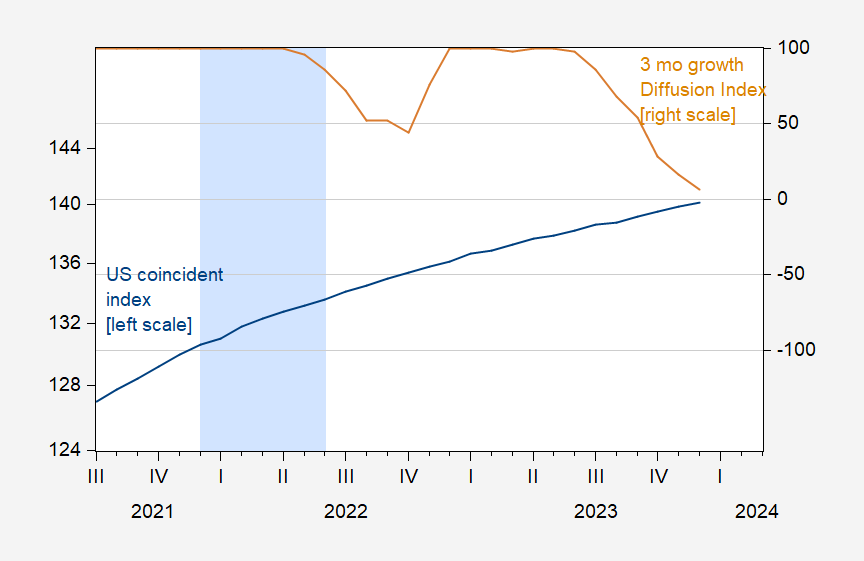
Figure 4: Coincident index for US (blue, left scale), and 3 month growth diffusion index (tan, right scale). +100 diffusion index means all states growing; -100 means all states contracting. Hypothesized 2022H1 recession shaded light blue. Source: Philadelphia Fed.
Note that the coincident index shows no declines over the conjectured recession period in 2022H1. In fact, a diffusion index based on number of states experiencing expansion/contraction shows a little dip in 2022H2, down to 86. For comparison sake, the diffusion index was 16 in 2001M04 when the recession is dated to have begun (NBER peak at 2001M03).
Finally, one can look to the labor market conditions as summarized by the unemployment rate. The Sahm rule (real time) indicator —the three month moving average relative to the minimum unemployment rate in the previous year — is displayed in Figure 5. The thresholdfor a recession onset is +0.5 ppts. The indicator was below zero for the 2022H1.

Figure 5: Sahm rule, in % (blue), and recession threshold (red dashed line). Source: FRED.
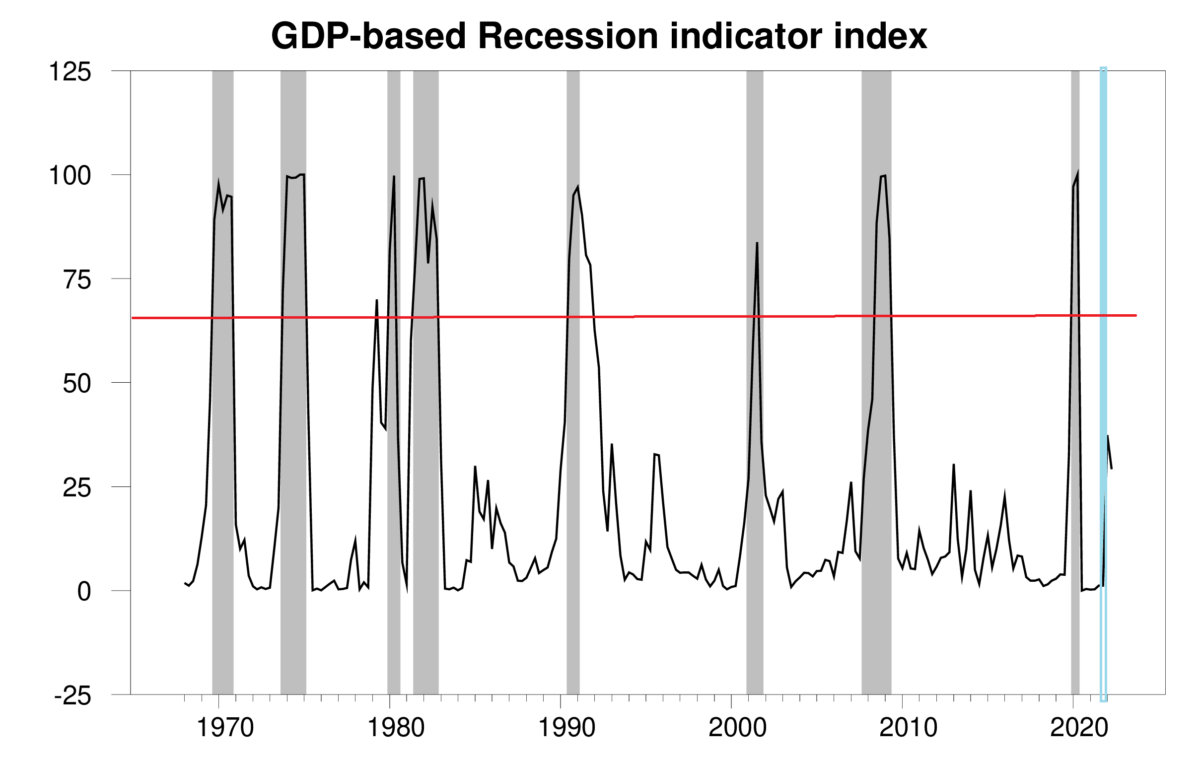
Now, suppose one wanted to use GDP — specifically GDP growth — as a means of determining whether one was in a recession. Jim Hamilton has exactly that methodology (you can access the probabilities on FRED here). Below, I post his estimated probabilities through 2022Q1, using the advance release of GDP for 2022Q2 in July 2022, with the graph annotated to include a posited recession in 2022H1, and the 65% threshold.

Source: Hamilton (2022a). Notes: Hamilton recession probabilities (black) and NBER defined recession dates shaded gray. Hypothesized 2022H1 recession shaded light blue. 65% threshold red line.
When the 2022Q3 advance release came out, Jim posted this graph (which I have annotated to include the posited 2022H1 recession).
Source: Hamilton (2022b). Notes: Hamilton recession probabilities (black) and NBER defined recession dates shaded gray. Hypothesized 2022H1 recession shaded light blue. 65% threshold red line.
Additional description of NBER definition of recession in these slides.
More By This Author:
Recessions Defined And (Maybe) PredictedExchange Rate Pass Through Into Import Prices, CPI
Business Cycle Indicators, Mid-February 2024


Comments
Log in or sign up to join the conversation.