
Oil, Gold, And The S&P 500 Short-Term And Long-Term Advice
Those of you that have been following my history lesson on the economy and markets know that I have divided the past 100-year history into four distinct periods with the latest period beginning in 1982 and running through to the present time.
Today I thought it would be worthwhile to show you how the S&P 500 hundred performed compared to two relatively important commodities (oil and gold) in three of my previously defined market periods. I believe there are very important lessons we can learn from this historical review. I will begin by showing you how the markets valued the S&P 500, gold, and oil between 1952-1972 (a period when the U.S. dominated the world economy as the rest of the world recovered from World War II).
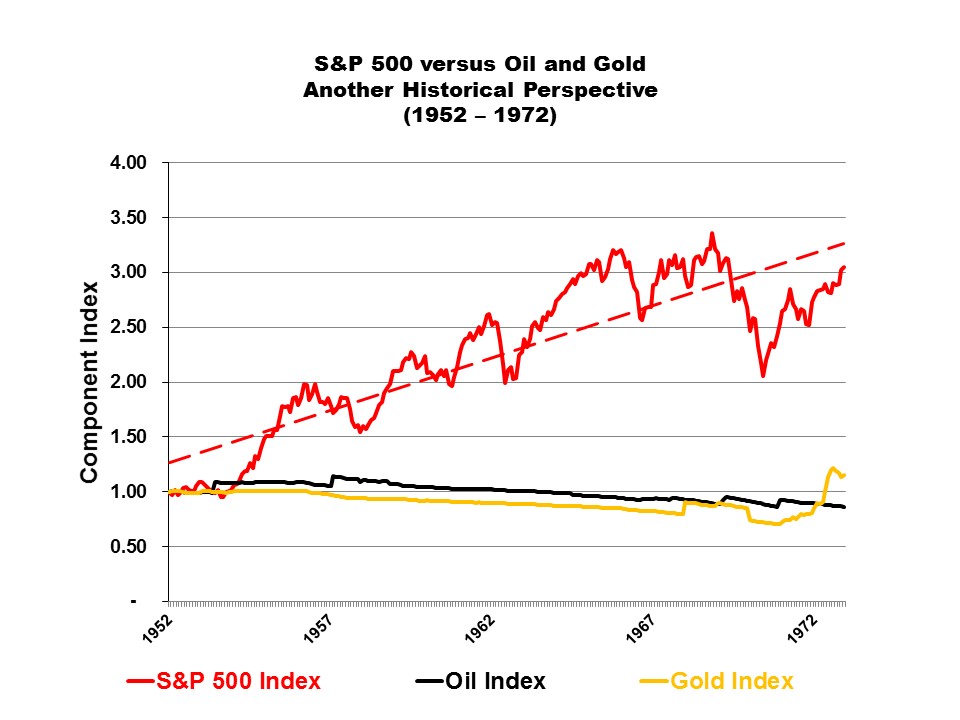
Interesting, isn’t it? During this rather unique period in our history, it looks like those investing in oil and gold would have lost out grandly to those who were investing in U.S. business. Over the 21-year period shown above, while the value of oil and gold hardly changed, the S&P 500 increased more than 200%.
“Yeah, Jim, but so what? Even though I do have to admit that I am a bit surprised in the clear distinction between the market performance of the commodities compared to the S&P 500 like you have been telling us, the U.S. dominated during this period and we’ll never see anything like this period again.”
Before I address your point, let me show you what my next market period (1973-1982) looked like.

“Oh, my goodness, Jim! Based upon what you are showing me here, it looks like all the gains I would have made in the S&P 500 in the previous period would have been wiped out in this period—and it looks like it happened all in one ten-year time period. What happened here, Jim?”
Well, two things really happened during this period that changed things in the United States.
First, note the step jump in 1973. After the Yom Kipper War in the fall of 1973, the Organization of Arab Petroleum Export Countries (OPEC) became a bit upset at the United States for its support of Israel during the war and they decided to implement an “oil embargo”. Oil prices jumped like never before and there was just simply, outside of starting another world war, nothing the United States could do about it.
Second, note the step jump in oil prices in 1979. This jump was due to the Iranian Revolution, which resulted in the expulsion of the “puppet government” that the United States had put into place through CIA manipulation during the Eisenhower presidency. For a short period after the Iranian Resolution, Iran oil was not available to the world markets and the world experienced another step jump in oil prices, later to be reversed over time as Iranian oil began to flow again.
Now with that explained, let’s look at the oil, gold, and S&P 500 during last of my historical market periods (1982-2017).
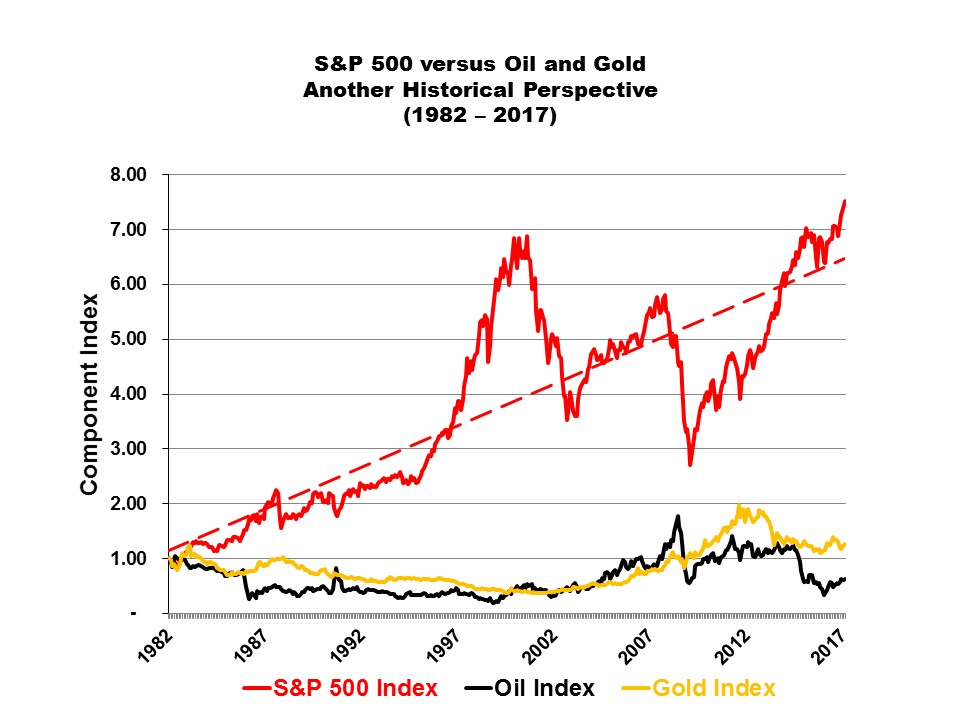
“Wow, Jim! It looks like I have seen something like this before.”
In fact, you have. Although it covers a much longer period (35-years), the above graph looks very much like the first graph I showed you—the period when the U.S. was dominant. Now here are a few history lessons that you might want to consider for your long-term and short-term investment strategy.
- Without major global turmoil or oligopoly-like commodity pricing conditions, investing in U.S. business is a good long run strategy and that is where I would put my long-term money;
- Oil is down right now and the S&P 500 a bit higher than a normalized trend, so in the short run, I would expect a correction. There are three things to keep in mind relating to oil and the short=term today:
- Our current President does seem to owe Vladimir Putin something and nothing would make the Russian dictator happier than to see an increase in the price of oil.
- Mr. Trump’s rather antagonistic attitude toward the Arab world is not necessarily conducive to lower oil prices; and
- Significant energy price fluctuations like those in the 1970s are less likely today because the U.S. is closer to self-sufficiency today than it was in the 1970s—especially when oil prices increase, making alternatives more viable.
In conclusion, stay positive America, but don't get too “giddy” over your new President. Market history shows that America was great before he was elected to become our 45th President and there is no reason that America should not remain great while he remains in office—unless, of course, global war breaks out or someone screws things up.
My next article: Look Out America--You Have Lost Your Moral Compass
Disclosure: No positions.


You forgot to mention that in 1971 the US went off the gold standard completely and let the price of gold fluctuate. Prior to that the price of gold was fixed. That would explain the relatively flat line for gold on your 1952 - 1972 chart.