NZDUSD Looking To End 5 Waves Move

Photo by Thomas Coker on Unsplash
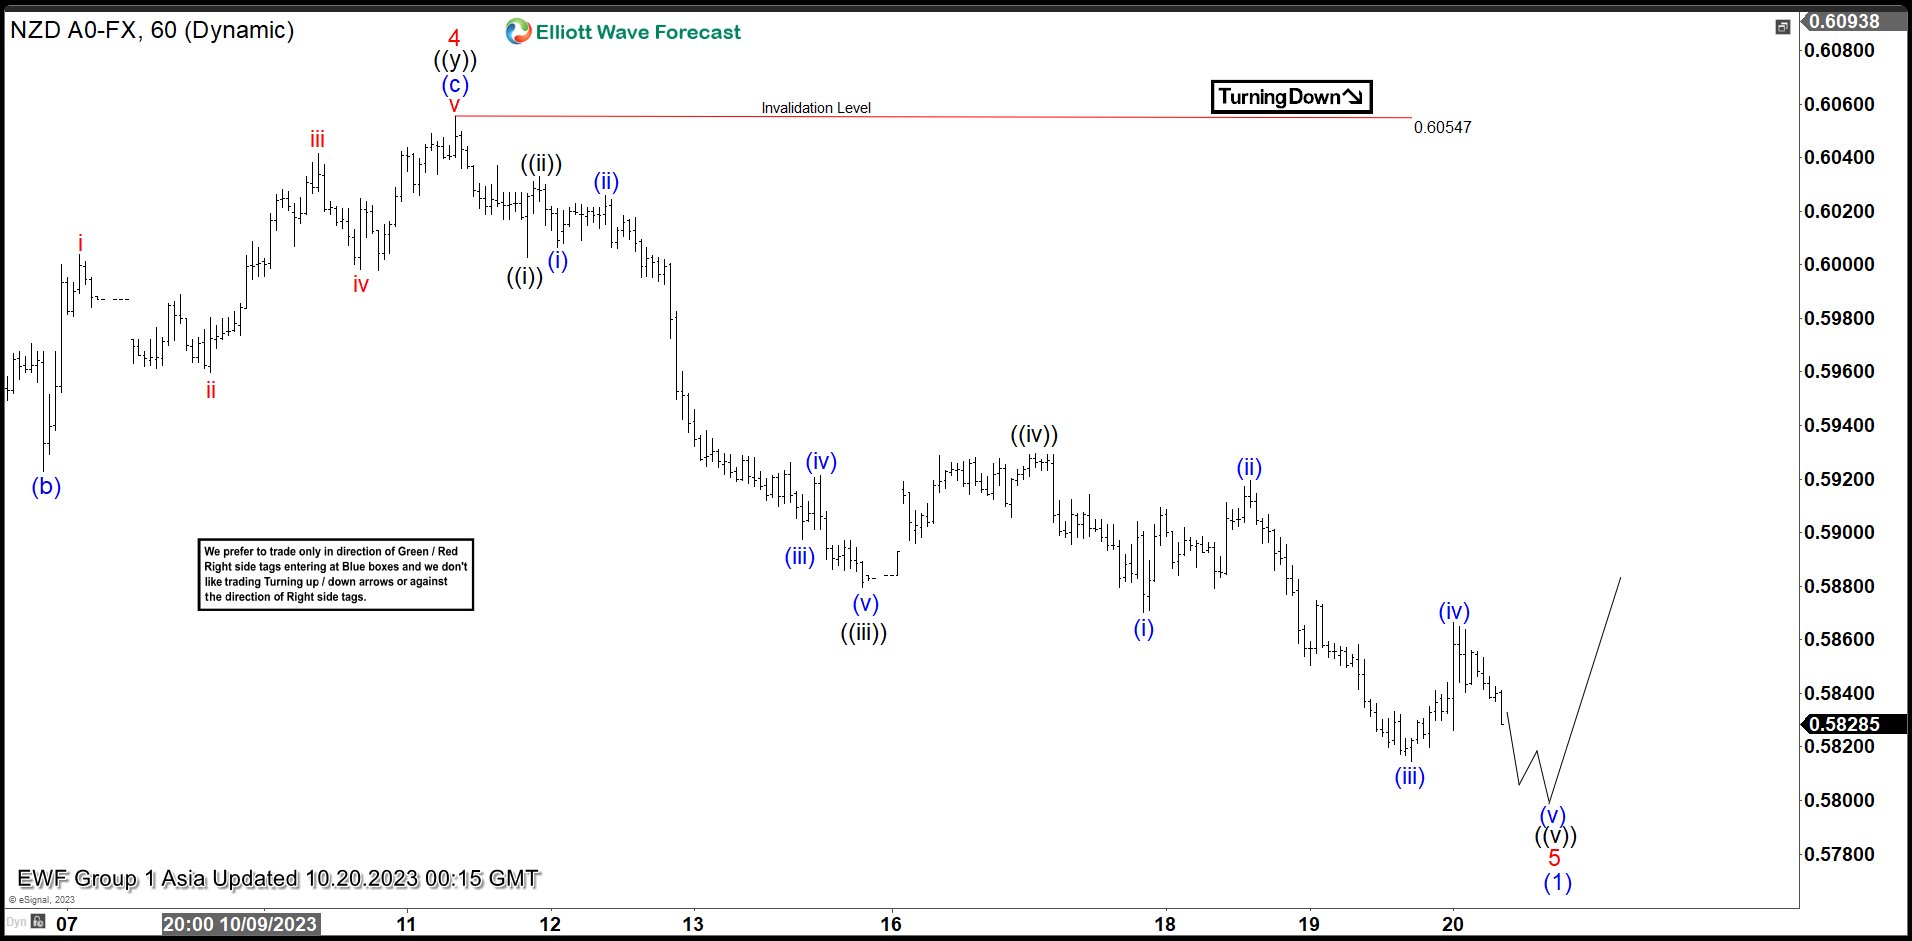
Short Term Elliott Wave in NZDUSD shows pair is unfolding as a 5 waves move lower from 2.2.2023 high. Down from 2.2.2023 high, wave 1 ended at 0.6084, and rally in wave 2 ended at 0.6411. The pair resumed lower in wave 3 towards 0.58594. Bounce in wave 4 ended at 0.6054 as the 1 hour chart below. Pair has resumed lower in wave 5. Internal subdivision of wave 5 is unfolding as a 5 waves impulse. Down from wave 4, wave ((i)) ended at 0.60, and rally in wave ((ii)) ended at 0.6033.
Pair resumed lower in wave ((iii)). Down from wave ((ii)), wave (i) ended at 0.6 and rally in wave (ii) ended at 0.6025. Wave (iii) lower ended at 0.5897 and rally in wave (iv) ended at 0.5921. Final leg lower wave (v) ended at 0.5879 which completed wave ((iii)). Pair then rallied in wave ((iv)) and ended at 0.5929. Pair has resumed lower in wave ((v)). Down from wave ((iv)), wave (i) ended at 0.587 and rally in wave (ii) ended at 0.5919. Wave (iii) lower ended at 0.5814 and rally in wave (iv) ended at 0.5866.
Expect wave (v) to end with 1 more push lower which should complete wave ((v)) of 5 of (1). Afterwards, pair should rally in larger degree wave (2) to correct cycle from 2.2.2023 high. Near term, as far as pivot at 0.6954 stays intact, expect pair to extend lower before ending cycle from 2.2.2023 high.
NZDUSD 60 Minutes Elliott Wave Chart
(Click on image to enlarge)
NZDUSD Elliott Wave Video
Video Length: 00:06:19
More By This Author:
Dow Futures Pullback May Find Support
Pullbacks In Lockheed Martin Remain Supported
Nasdaq Futures Reacting From Equal Legs Area
Disclaimer: Futures, options, and over the counter foreign exchange products may involve substantial risk and may not be suitable for all investors. Leverage can work against you as well as for ...
more


