Nowcasts And Forecasts – Mid-September
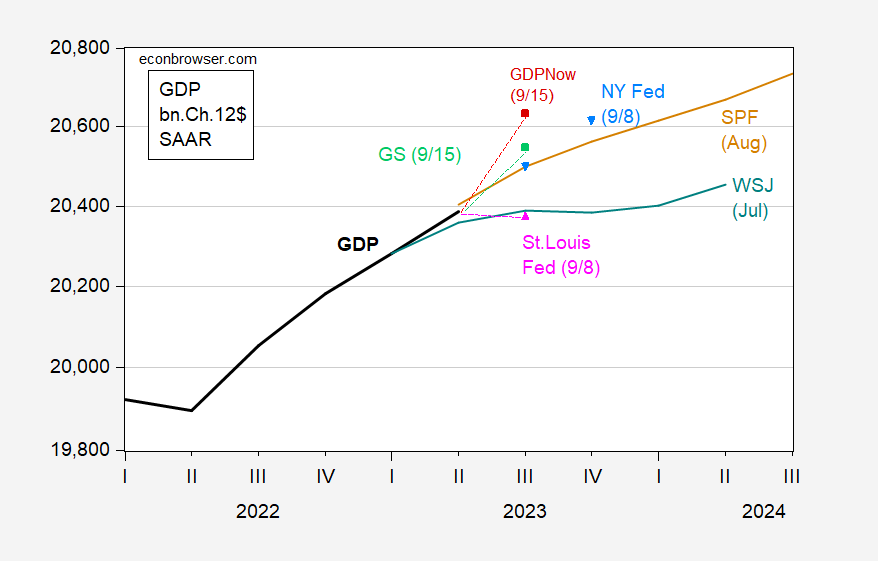
GDPNow Q3 revised slightly down (4.9% SAAR), GS about the same (3.2%).

Figure 1: GDP (bold black), Survey of Professional Forecasters median (tan), WSJ July mean (teal), GDPNow 9/15 (red square), Goldman Sachs 9/15 (light green square), St. Louis Fed Economic News Index 9/8 (pink triangle), NY Fed nowcast 9/8 (light blue triangle), all in billions Ch.2012$ SAAR. Source: BEA 2023Q2 second release, Philadelphia Fed, Atlanta Fed, St. Louis Fed via FRED, NY Fed.
The improvement in perceived prospects is highlighted by the shift from the July WSJ (which was compiled before the advance 2023Q2 release) and the August SPF, compiled after the release. Both level and growth rates increased substantially (the July CBO projection, compiled in June, is close to the WSJ July forecast).
The Atlanta Fed nowcast, despite the drop from about 5.7% SAAR, still outpaces the SPF median, as does the GS tracking.
Upside surprise to August industrial production (+0.4% m/m vs. Bloomberg consensus +0.1%) further supports the outlook of continued growth.
More By This Author:
Inflation In JulyCalling Graduate Students Of The 1980’s…
How Much Have (Ex Ante) Real Rates Risen?


