

Image Source: Unsplash
The latest monthly data on home prices was published earlier this week from S&P CoreLogic's Case Shiller indices. Case Shiller indices are published on a two-month lag, but they break down price levels across twenty major cities around the country.
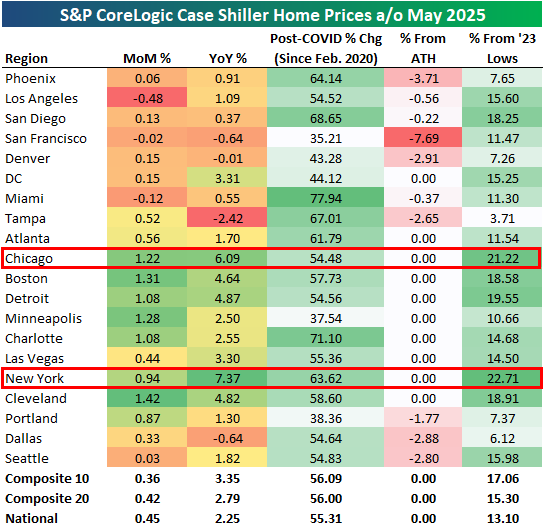
Below is a look at the latest data. Seventeen of twenty cities were up month-over-month, with many cities up more than 1%: Chicago, Boston, Detroit, Minneapolis, Charlotte, and Cleveland. The three cities that were down m/m were Los Angeles, San Francisco, and Miami.
On a year-over-year basis, the national reading came in at +2.25%, but there's quite a bit of disparity across cities. Tampa, Dallas, San Francisco, and Denver are actually down year-over-year, while New York and Chicago are up 6%+. New York is actually up the most of any city tracked over the last year with home price gains of 7.4%.
Exactly half of the twenty cities tracked hit new all-time highs in May. San Francisco is the city where prices are down the most from their highs at -7.7%.
Back in 2022 and early 2023, we saw a dip in home prices after seeing a huge post-COVID surge in 2020 and 2021. Since that dip, though, prices nationally have rallied roughly 13%. The two cities that have seen the biggest rallies since their 2023 lows are Chicago and New York, which are both up more than 20%.
In terms of prices, given their y/y readings and their gains since early 2023, New York and Chicago have been the hottest markets in the last couple of years. Conversely, the West Coast and Southeast have seen the most weakness.
More By This Author:
Powell Fed Days: 7 LeftTech Sector Now 1/3rd Of S&P
"Rest Of World" Equities Finally Break Out


Comments
Log in or sign up to join the conversation.