New Housing Construction Appears To Have Bottomed; But Expect Further Declines In Construction Employment Ahead
For the past few months, I’ve noted that new home sales, which while very volatile frequently are the first metric to signal a change in trend, appeared to have bottomed by early last autumn. This morning’s report on housing permits and starts appears to have confirmed that signal.
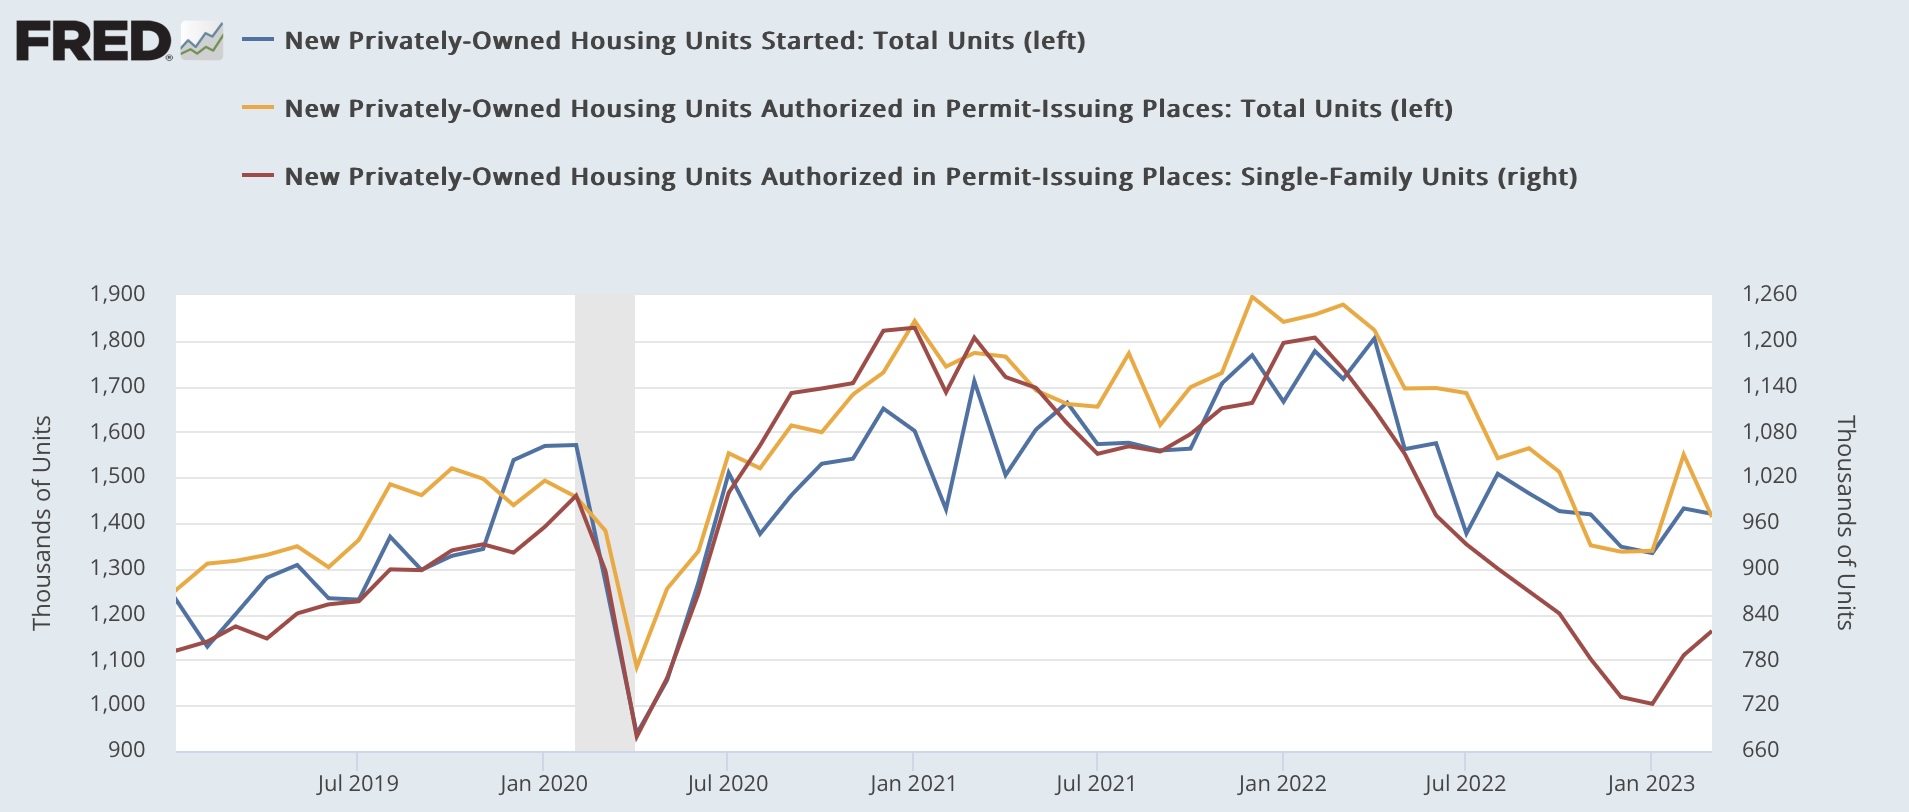
While total housing permits (gold in the graph below) declined -137,000 on a seasonally adjusted annual rate from last month, they remained higher than their November-January lows by about 75,000. Starts (blue), which are noisier and tend to lag a month or so, also declined -12,000 but remained 86,000 higher than their January low. Most importantly, single family permits (red, right scale) which are the least volatile measure of the three, rose 32,000, for the second straight monthly increase, and are now almost 100,000 above their January low:
(Click on image to enlarge)

It is very likely that the bottom for the housing sales market is in. Remember that sales follow interest rates, and in particular mortgage rates, which peaked last October and November. Below is a the latest update of the graph comparing the YoY change in mortgage rates (blue, inverted, *10 for scale) with the YoY% change in both total and single family permits:
(Click on image to enlarge)

This is all good news, despite the monthly declines in total permits and starts.
The one important piece of bad news is that total housing units under construction declined again (blue in the graphs below), and are now -2.2% below their October peak. As I’ve noted monthly for a while now, this is the metric that shows the actual total economic activity of the housing market, so it shows that housing is now detracting from GDP. Further, once construction turns down, shortly thereafter so does construction employment (red). Here is the historical view until the pandemic:
(Click on image to enlarge)

Now here is the last year, with both metrics normed to 100 as of their peak months:
(Click on image to enlarge)

Nonfarm payrolls has been the main coincident indicator holding up the economy, and construction employment is one of the leading sectors of the jobs market overall. This morning’s report tells us to expect further declines in that jobs sector.
More By This Author:
Positive Revisions Make For A Good March Industrial Production ReportReal Manufacturing And Trade Sales Probably Rose To A New Record High In February; May Have Declined In March
March Real Retail Sales Lay An Egg, Suggest Downturn In Nonfarm Payrolls By The End Of Summer
Disclaimer: This blog contains opinions and observations. It is not professional advice in any way, shape or form and should not be construed that way. In other words, buyer beware.


