New Home Sales For February Increase; Likely Bottomed Last July
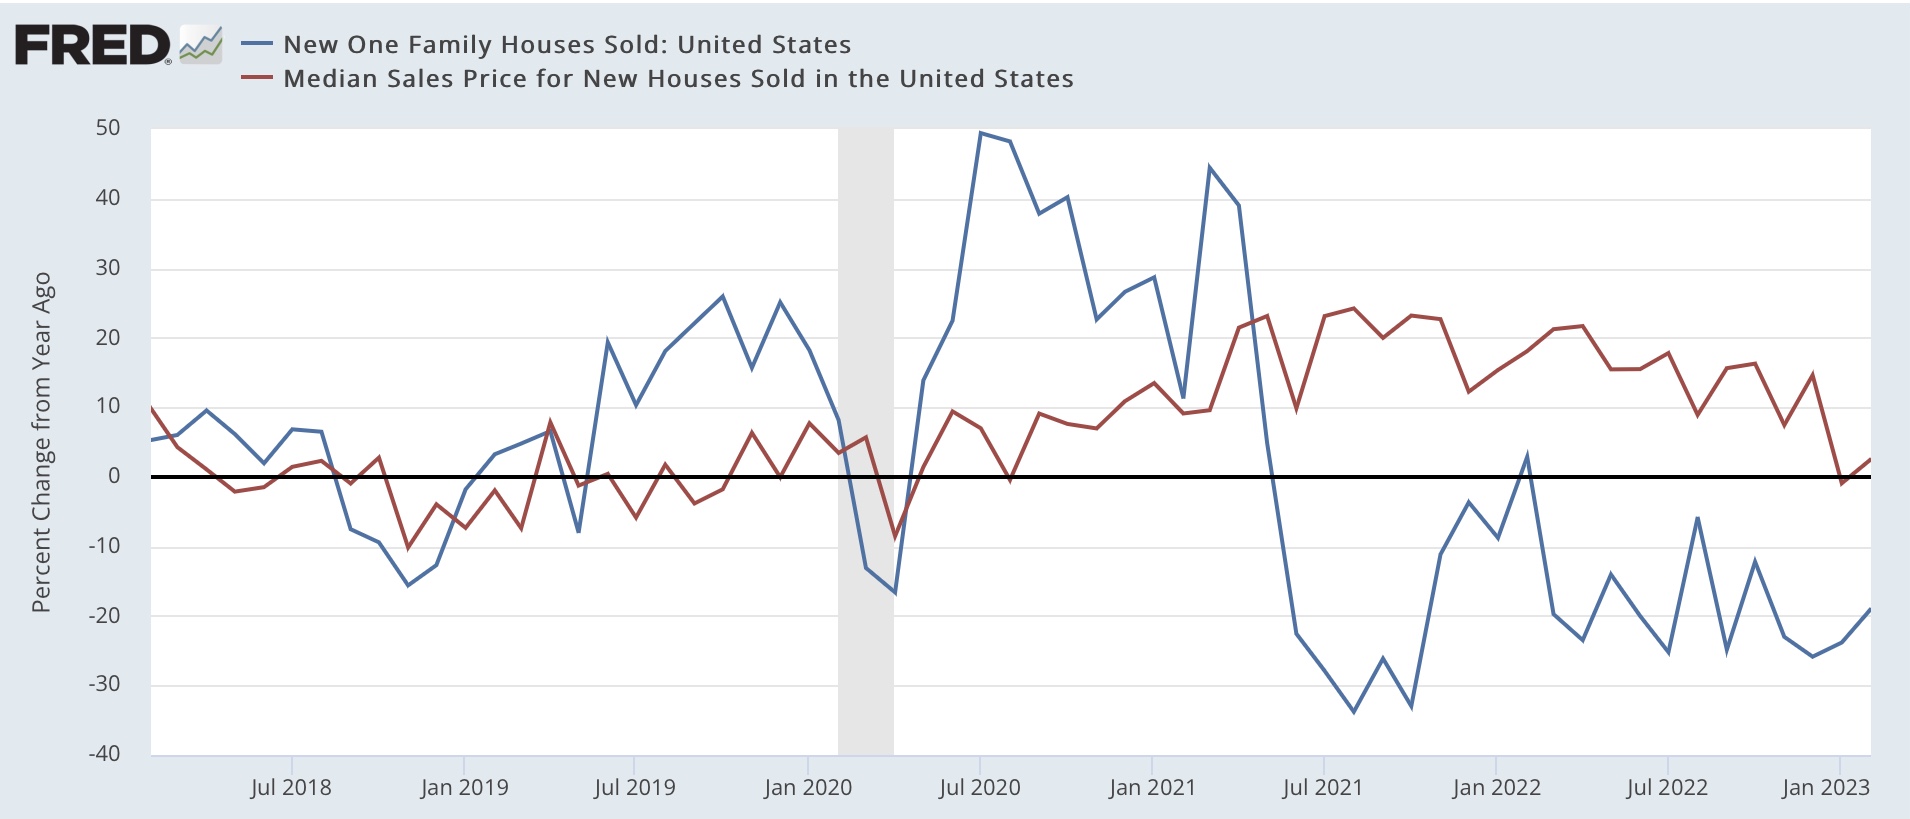
Most of what you probably read elsewhere focuses on new home prices, which after finally declining -0.7% YoY in January, rebounded to +2.5% YoY. As is usual, prices follow sales YoY with a considerable lag (note since prices are not seasonally adjusted, this is the right way to make the comparison):
(Click on image to enlarge)

In fact, if you’ve been reading me and following my rule of thumb, the peak occurred months ago, once the YoY gains had decelerated by over 50%.
But the most important news was actually in the seasonally adjusted sales, which at 640,000 annualized increased 7,000 from a seriously downwardly revised (by -37,000) January. Big deal, you say? Here’s a graph of the last several years:
(Click on image to enlarge)

While revisions can still be made to the last several months, it is apparent that the bottom for new home sales was last July, at 543,000 annualized. There has been an almost consistent monthly increase since.
This joins existing home sales, which likely bottomed in December; and housing permits and the three-month average of starts, both of which possibly bottomed in January. As I’ve written many times before, while new home sales are very noisy and heavily revised, they are frequently the first housing data to turn. And it appears they have.
More By This Author:
Updating 3 High Frequency Indictors: No Recession Yet, But No Paucity Of Yellow FlagsFebruary Existing Home Sales Confirm Prices Have Declined, But Bottom In Sales And Construction May Be In
Average And Aggregate Nonsupervisory Wages For February
Disclaimer: This blog contains opinions and observations. It is not professional advice in any way, shape or form and should not be construed that way. In other words, buyer beware.


