
Nasdaq And 3 Potential Pitfalls: Weekly Nifty 9
Welcome to this week's Research Report insights from Finom Group (for whom I am employed). Each week we offer a deep dive into every aspect of the macro-picture to analyze the most probable path forward for equity and bond markets. Additionally, we offer insights from our weekly Research Report titled the Weekly Nifty 9.
Research Report Excerpt #1
Are we on the cusp of another double-digit Nasdaq correction? Anything is possible, and since reaching it’s a new all-time high on 4/29/2021 of 14,211, the growth and tech-heavy Nasdaq has once again come under pressure, even with bond yields under pressure.

From the Nasdaq high to the most recent low, the index has already consolidated some 5% before rebounding on Thursday and Friday of this past week. We definitely see the shift in investor sentiment and style lately, but to the degree, it will persist remains an unknown. Tech earnings season is largely over, shy of a handful of companies such as Alibaba and Nvidia in the coming weeks.
Research Report Excerpt #2
When it comes to the Information Technology sector and/or Growth, it doesn’t get any more “Techno” or growth-ier than Apple (AAPL). The stock is the #1 weighted stock in the Nasdaq 100. In 2021, the Golden Capital Portfolio has grown its exposure to AAPL shares, but in a defined manner such that it benefits the overall cost average of existing holdings. We’ve done this through 16 issued trade alerts for Finom Group members, as depicted below:
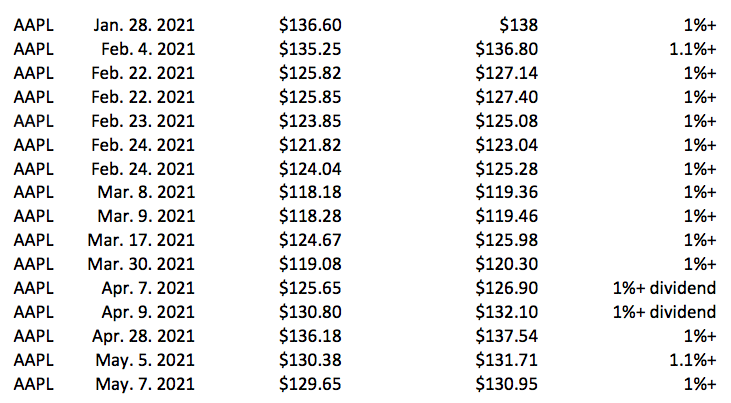
After some of the strongest results Apple has issued in more than 5 years, we anticipate any additional weakness in AAPL to provide additional trading opportunities. Apple is one of Finom Group’s Top 5 picks for 2021, not solely due to forward return expectations, but from a trading confidence standpoint as well. The fundamentals guide the long-term potential returns, and the fundamentals have improved, even as the stock has come under pressure post delivering strong Q2 2021 results. (Apple reports 1 quarter ahead). Our trading regiment suggests that should our entries not prove optimal, our time for the trade need only be extended, which is what the recent history provides and the long-term fundamentals validate i.e. confidently trading.
Research Report Excerpt #3
“There can be growing companies that are cheap and cheap companies that grow, so value and growth are not in opposition,” says equity portfolio manager Martin Romo. “We are in a target rich environment, and there are opportunities to invest in fast growing companies as well as classic cyclical companies.”
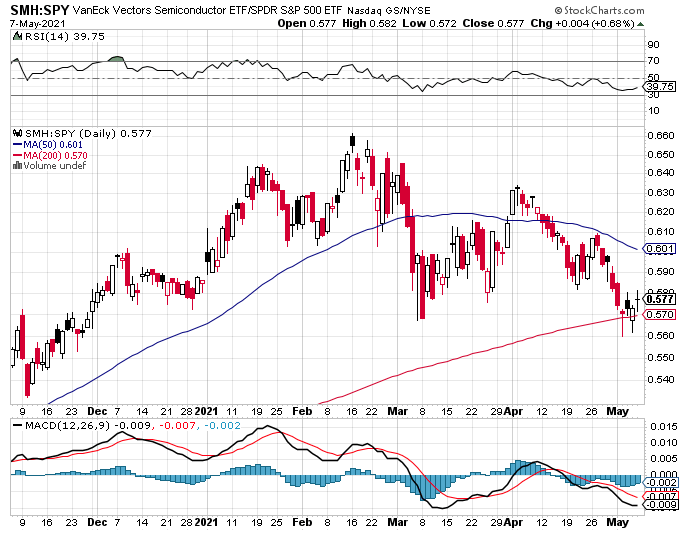
The chart above is yet another relative performance ratio chart. This time it is the semiconductor ETF (SMH) relative to the S&P 500 ETF (SPY). We touched on the chart during our weekly State of the Market video and as an update, the ratio ended the week just above it’s 200-DMA, with a minor improvement from Thursday. To emphasize thinking long-term, but acting on local price weakness, Finom Group believes this is another way to express such a belief by way of the largest technology component. While the chart suggests that semiconductors are likely to continue to underperform the S&P 500 near-term, the technicals only inform of the past and the developing situation. Anything can happen in the coming week to throw the chart off-track.
I view semiconductors as the single most important innovation of our generation. Semiconductors have become central to telecommunications, the internet, data analysis, artificial intelligence, cars, and physical products of all kinds. Since about 1965, the computing power of semiconductors has doubled about once every 18 months – 2 years, so-called Moore’s law. We’re now into cosmic measurements. And that’s why it’s impacting almost everything we do. As World War II was a leap forward in mass production, COVID, I think, is a leap forward in the capabilities of the semiconductor.
Recent chip shortages are a case in point. Companies can’t get enough of them. Auto companies are struggling with their production costs, and countries are starting to say, “This is a strategic resource, and we’ve got to either develop our own domestic industry or find ways to capture production.”
- Take, for example, specialty retailer Williams-Sonoma, which recently said its online sales have surpassed their physical store sales. They are using that leverage to renegotiate lease agreements, changing the economics of their physical stores as their online traffic has increased. They flipped the world from physical to virtual in one year and aren’t turning back.
- Companies like Mondelez, which spent billions of dollars and a great majority of their advertising budget on TV, are now getting a 25% greater return online and, in fact, 40% better than that if they think about Google and Facebook as their primary ad sources.
- And then, in streaming content services, Netflix became the largest content creator in the world at more than $20 billion spend in 2020.
Semiconductors have enabled this flywheel of innovation and efficiency. The collection of data, the analysis of that data to develop a better product that draws more consumers, whose use generates more data, becomes a virtuous cycle of improvement and wider adoption. It is driving the cost of engagement down and the effectiveness of all our activity higher. And I believe we are still early in this cycle.
Chip suppliers fuel the power behind great products

Research Report Excerpt #4
We’ve now gone 35 straight days without the S&P 500 dropping 1% or more and 25 straight days of >90% of S&P stocks trading above their 200-day moving averages. This is what a strong bull market looks like. This is what a remarkably strong bull market looks like maybe, but maybe that is what the analysts and strategists are ignoring or missing in their analysis. Why, why indeed, has the market remained so resilient and with seemingly endless new highs. I think market breadth helps to answer the questions about correction magnitude probabilities, and what they have maybe been ignoring. For example Tony Dwyer of Canaccord Genuity and a long-time friend of mine.

In Tony’s call for a 10% correction, over a couple of months on April 20, 2021, the strategist also lowered his market outlook from Overweight to Neutral. This, even with the breadth indicators noted above. Not to mention the expansion of New highs – New Lows in the NYSE, basically the highest it has been since… well I can’t remember when! The chart below is extremely potent.
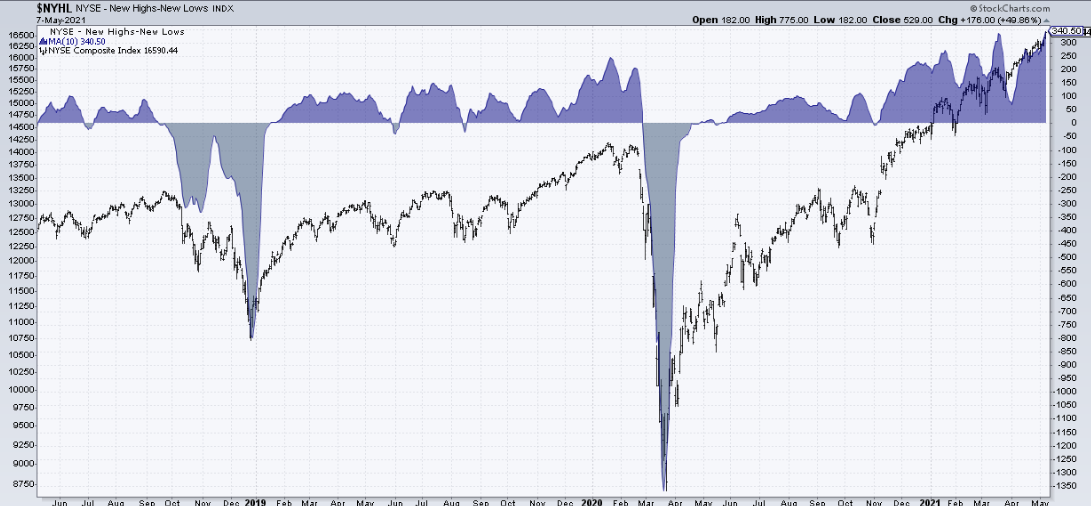
From the S&P 500 A/D lines hitting new all-time highs to expanding new highs for the NYSE, that’s enough to warrant caution about these cautionary correction calls I would think? But there’s always one just around the corner and seemingly every day. Some of the historic data does indeed suggest that a 10% correction is probable in year 2 of a new bull market. Pullbacks tend to happen during the second year of a new bull market, with an average year two pullback of 10.2% in fact. Considering the current bull market reflected the best start to a bull market ever, this could open the door for an above-average pullback during year two.
Research Report Excerpt #5
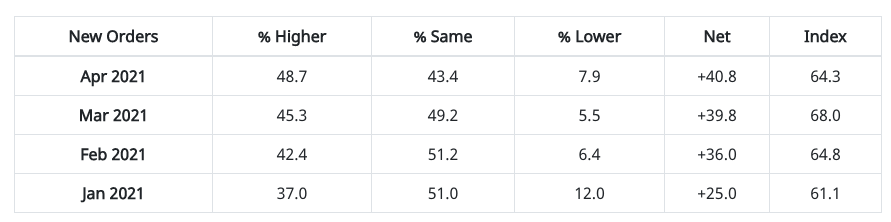
The Institute for Supply Management said its manufacturing index fell to 60.7% in April from a 38-year high of 64.7% in the prior month. While readings over 60% are exceptional, top manufacturing executives say they are struggling to overcome key shortages that are causing the prices of most goods to rise, in some cases sharply.
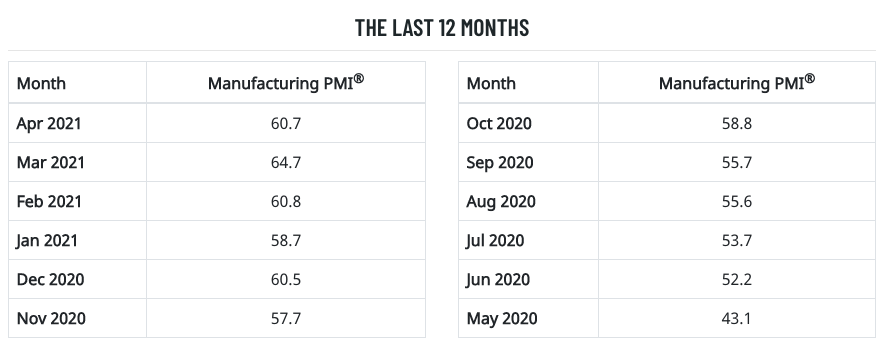
ISM New Orders Index registered 64.3% in April, down 3.7 percentage points compared to the 68% reported in March. This indicates that new orders grew for the 11th consecutive month. “All of the six largest manufacturing sectors — Fabricated Metal Products; Chemical Products; Food, Beverage & Tobacco Products; Transportation Equipment; Computer & Electronic Products; and Petroleum & Coal Products — expanded at strong levels,” says Fiore.
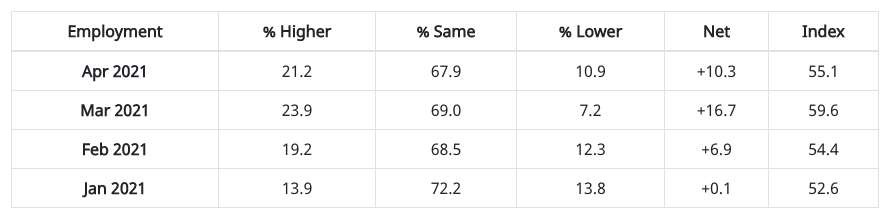
ISM’s Employment Index registered 55.1 percent in April, 4.5 percentage points lower than the March reading of 59.6 percent. “The Employment Index grew for the fifth month in a row. Of the six big manufacturing sectors, four (Fabricated Metal Products; Food, Beverage & Tobacco Products; Transportation Equipment; and Computer & Electronic Products) expanded. Continued strong new-order levels, low customer inventories, and expanding backlogs indicate potential employment strength for the balance of the quarter. For the eighth straight month, survey panelists’ comments indicate that significantly more companies are hiring or attempting to hire than those looking to reduce headcounts,” says Fiore.
Research Report Excerpt #6
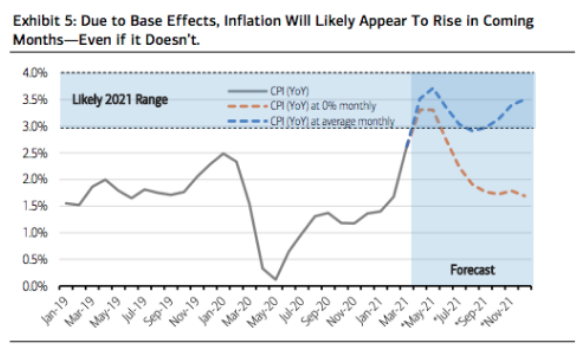
Finom Group is anticipating strong rises in the PPI and CPI readings this coming week. We also believe that is the majority expectation, and as such, surges in prices should be recognized as commonplace and part of the typical “base effect” previously discussed. We should expect the base effects of Consumer Price inflation over the coming 3-5 month period to show up in CPI. The chart below identifies the clear inverse from the 2020 trough (negative CPI) in the 2021 forecast.
Research Report Excerpt #7
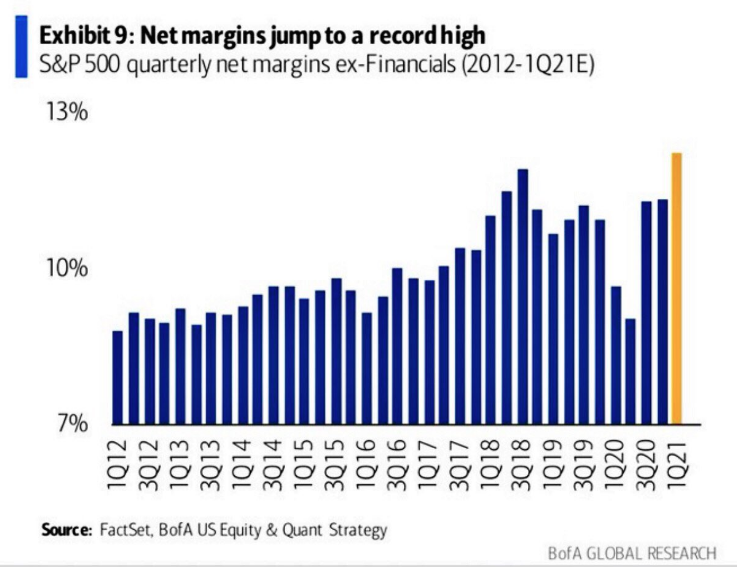
Based on the past week’s released earnings amongst S&P 500 companies, Finom Group is upwardly revising our FY21 EPS outlook. Our former EPS outlook called for $185 per share in earnings for the calendar year and we have raised this outlook to reflect $193 in FY21 EPS. We believe that the abundant deleveraging that has taken place at both the corporate and household level will lend itself to that much more consumer spending and earnings power in the back half of 2021.
Cutting costs and boosting prices for products seems to be working well for companies already. Net margins (ex-Financials) have jumped to a record high thus far. It’s clear that commodity cost impacts are not negatively reflected in margins, as they are largely offset by deleveraging costs elsewhere. Don’t lose sight of this metric should PPI and CPI cause market disruptions in the coming week.
Research Report Excerpt #8
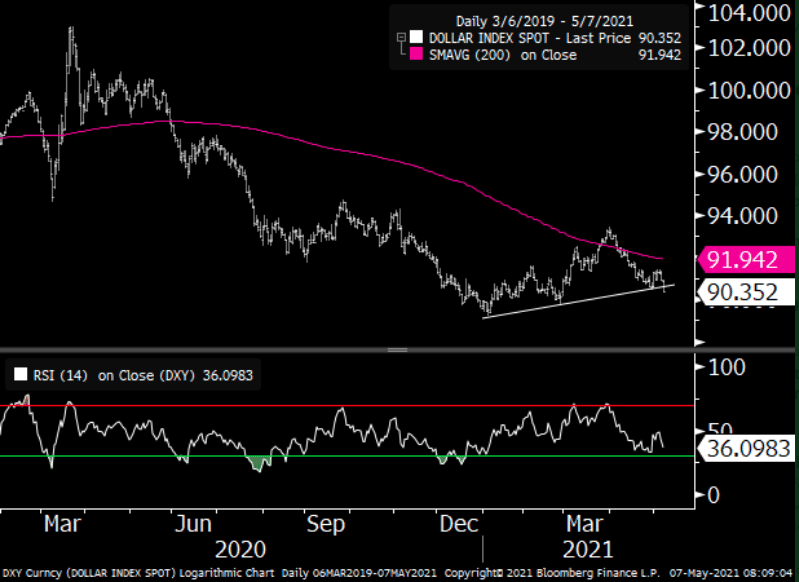
Buybacks generally prove another tailwind for earnings growth, beyond that of improving gross margins through deleveraging and streamlining of business operations. Least we forget the impact of a weaker dollar on earnings growth, which also provides a boost to the bottom line? The chart below shows the dollar has broken the 2021 uptrend line as of this past week, to the downside!
Research Report Excerpt #9
Nonetheless, the biggest risks to the markets and for investors will generally come from the macro-economic trends. Some of the bigger risks ahead include the following:
- Tax increases: The Biden Administration has outlined plans for the $2.25 trillion American Jobs Plan and the $1.8 trillion American Family Plan, and corporate and individual tax increases are the potential ways to pay for these stimulus packages. The “consensus” view is that any eventual tax increases will not be as large as initially proposed. Any divergence from that “assumption” would be a market negative.
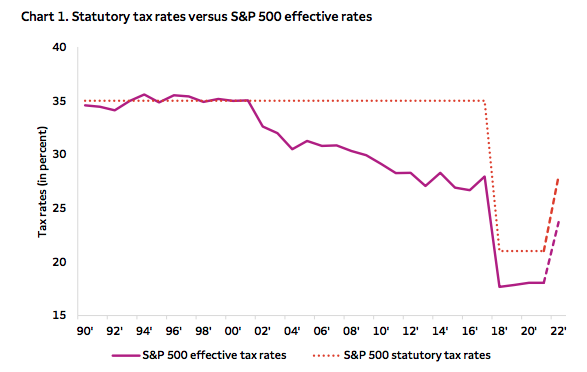
- Finom Group is of the opinion that the corporate tax hike would not likely gain traction in excess of a rise to 25%. Additionally, keep in mind that the statutory tax rate and effective tax rate usually vary by about 5 percentage points. Corporations generally pay the lower, effective tax rate, which largely goes unrecognized by the financial media.
-
The risk of stickier and sustained inflationary pressures as opposed to the Fed’s expectations of transitory price increases: As the St. Louis Fed advised in December 2020, Americans may have to “prepare themselves for a temporary burst of inflation.” Indeed, prepare they should—inflation is back, but for how long and at what level? In March, the U.S. consumer price index (CPI) was 2.6% higher than a year earlier, the biggest increase since November 2009. Not to worry, according to the consensus, due to the “base effects” or the fact that in the spring of 2020, consumer prices fell for three consecutive months as the pandemic shut down the U.S. economy. A year later, and following massive dollops of fiscal and monetary stimulus, the YoY comparisons are trending ahead of the Fed’s annual inflation target of 2%, stoking fears among some investors and prominent economists that the U.S. economy is likely set to overheat. Adding fuel to the fire, in March, the producer price index (PPI) for final demand rose to 4.2%, a figure well above consensus expectations and the biggest 12-month gain in almost a decade
- A Taper Tantrum: If the Fed adjusts policy prior to investor expectations of any adjustment it won’t be pretty. I’m not saying a rise in rates during a solid economic growth phase isn’t warranted, but the market is NOT YET expecting that shift. The consistent stance echoed by the Federal Reserve that keeps rates at these levels until 2023 is ingrained in the minds of market participants. The equity market has traditionally reacted negatively to such a move, this time will likely prove no different. The earliest shift we potentially see is primarily in the Fed’s messaging about QE and possible at the Jackson Hole Summit in August. This is only more probable if in fact inflation proves stickier or too robust.
Disclaimer: The risk of loss in stock, stock/options, futures, futures/options, and forex trading is substantial, and site visitors and subscribers should consider whether trading these markets ...
more

