
Gianluca Benigno notes that the NY Fed’s GSCPI, used in this post on using a naive expectations augmented Phillips curve to predict inflation, can be used independently to predict inflation, as in Akinci, et al. “How much can GSCPI improvement help reduce inflation” (Feb 2023).
First, both global supply and global demand factors are associated with intermediate demand goods PPI inflation, consistent with the globally traded nature of the goods in this index. Second, the U.S.-specific demand factor becomes relevant in contributing to CPI inflation on top of supply components captured by the GSCPI. Third, as could be expected, the GSCPI is more associated with goods CPI inflation than with overall inflation.
The following figure shows the impact of oil, supply chain pressures and what is unexplained.
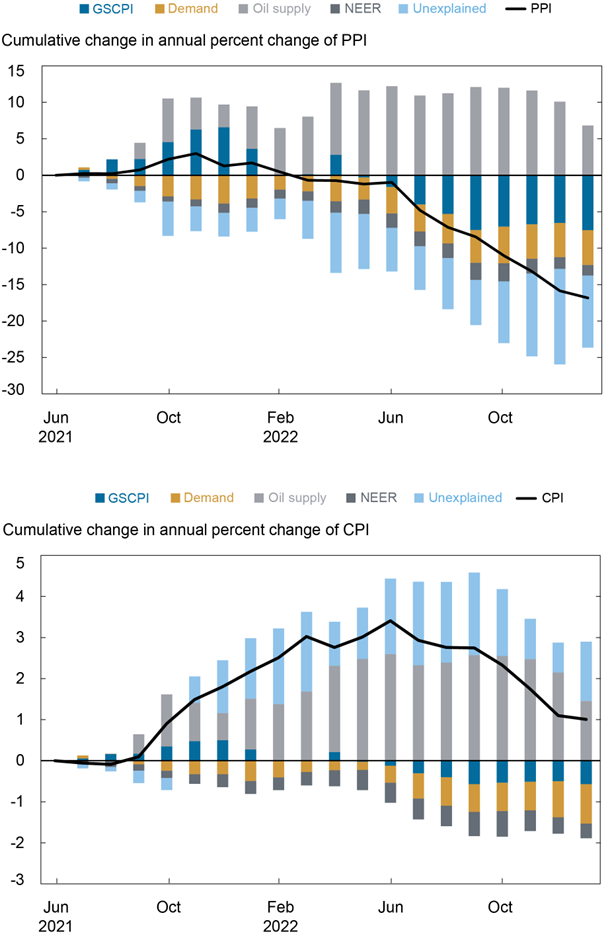
It’s interesting to see how much oil has contributed to upward inflationary pressures, while GSCPI contributed somewhat in 2021, moving to negative in the second half of 2022. In other words, a substantial portion of current inflation is due to the upward movement in oil prices. While their approach does not include inflation expectations, Benigno observed to me that the Michigan measure is highly correlated with oil prices (see here).
As an aside, this point should inspire one to try purging the inflation expectations measure I used of its correlation with oil price changes, so as to mitigate the multicollinearity issue in the regressions used in this post.
More By This Author:
One Year Ahead Inflation ExpectationsHow Well Does a Naive Expectations Augmented Phillips Curve with Cost Push Shocks Fit PCE Inflation?
Is The Lagged One Year Inflation Rate A Good Predictor Of Five Year Ahead Inflation?


Comments
Log in or sign up to join the conversation.