
The debate over whether the establishment survey (Current Employment Statistics) is mis-measuring employment growth over the April-June 2022 period continues, with the Philadelphia Fed asserting the net job growth was only 10 thousand, vs. the roughly 1 million reported by BLS.

The outcomes of their calculations are presented in the following figure:
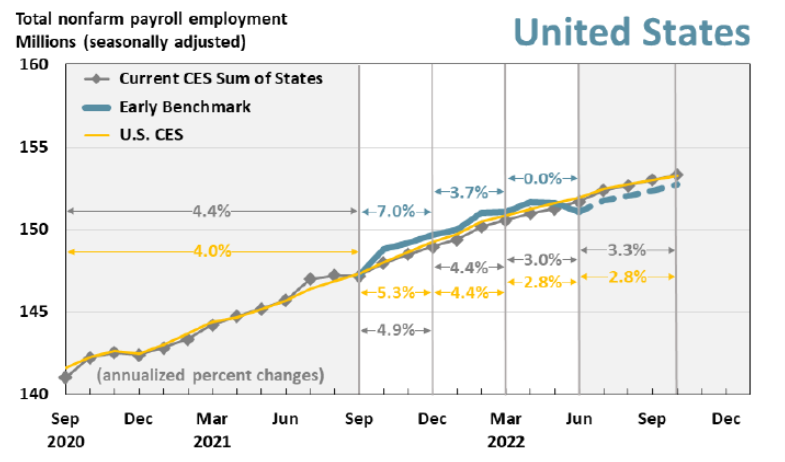
As I understand it, the analysts go down to the state level, adjust to match QCEW levels to NFP, seasonally adjust, and then aggregate up to national level using the state level data. I have no good feeling for how well their procedure works over time (explained here), but the approach seems plausible.
In contrast, I have compared the series at a high level of aggregation to see if the NFP series as reported by the CES is behaving in an anomalous way with respect to the QCEW. Since the latter is in not-seasonally adjusted terms, then one would want to compare against the NFP in not-seasonally adjusted terms. Shown below are comparisons in percent terms (gap at 2022M06 is 0.36 ppts, log terms), and in absolute (000’s) terms (gap is 581 thousand).
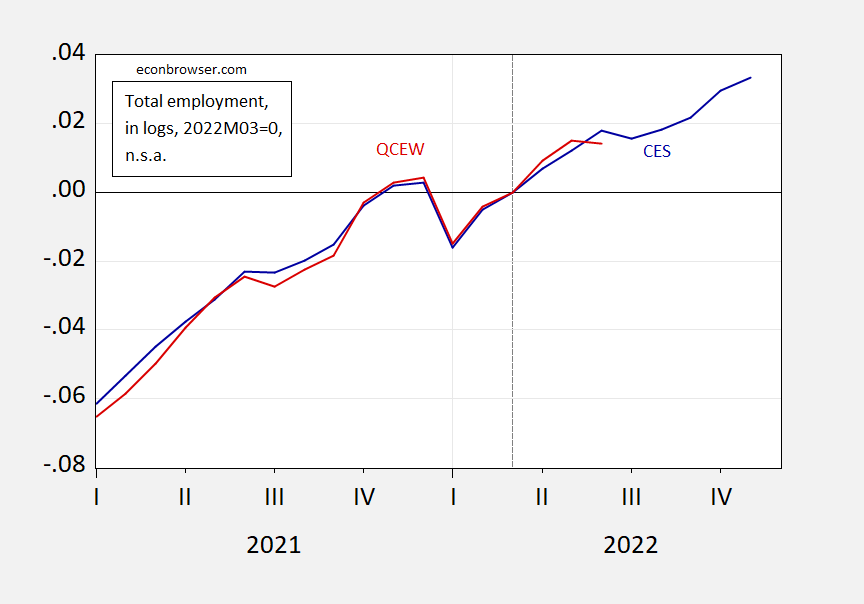
Figure 1: Nonfarm payroll employment (blue), and total covered employment in US (red), not seasonally adjusted, all in logs, 2022M03=0. Source: BLS, and athor’s calculations.
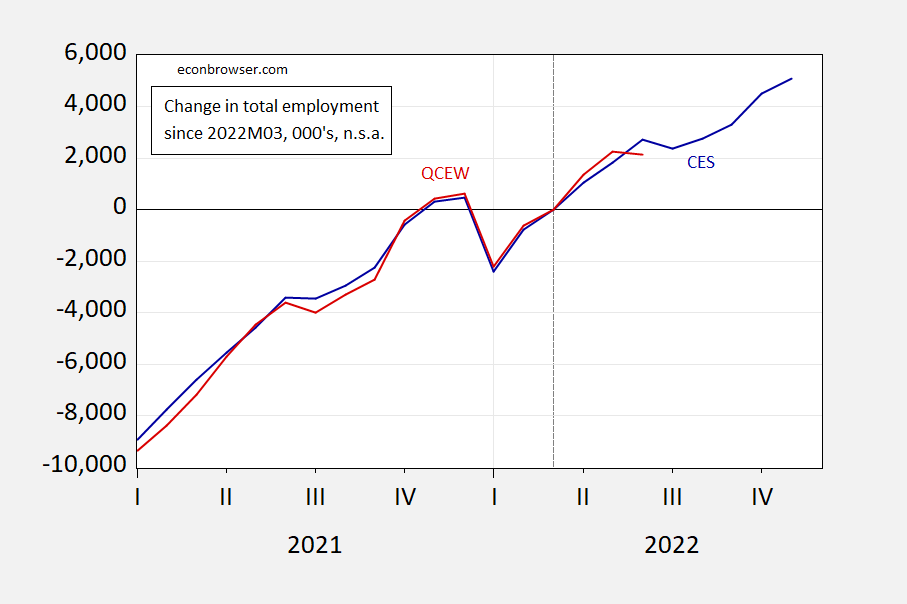
Figure 2: Nonfarm payroll employment (blue), and total covered employment in US (red), not seasonally adjusted, relative to 2022M03, in 000’s. Source: BLS, calculations.
If one thought that QCEW was more accurate, and nonfarm payroll inaccurate, then one would want to see if the relationship between them had changed. In point of fact, reported employment has been lower than average in the past year, and with the exception of 22M06.
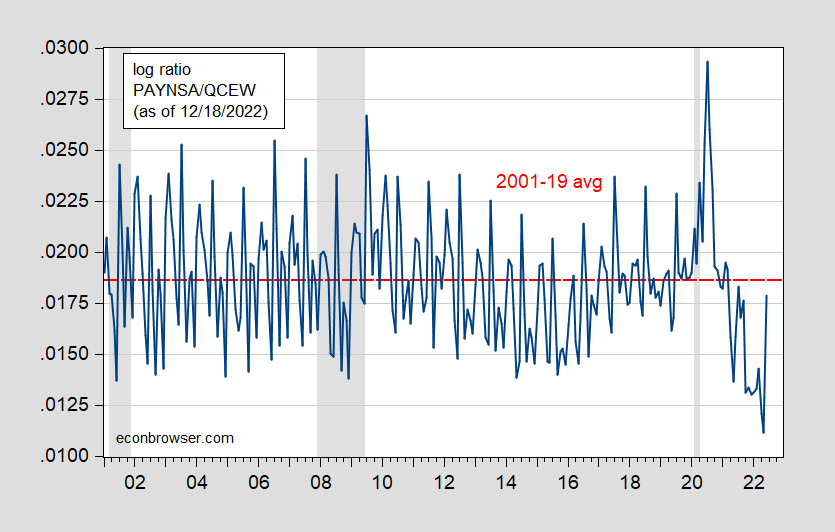
Figure 3: Log ratio of nsa NFP to QCEW (blue), and 2001-19 average (red dashed line). NBER defined peak-to-trough recession dates shaded gray. Source: BLS via FRED, BLS (as of 12/18/2022), NBER, and author’s calculations.
As I noted earlier, for private NFP, we have independent verification of trends through the ADP survey, which shows much higher job creation than the BLS series.
More By This Author:
Business Cycle Indicators, Mid-DecemberWhy The Increase In Multiple Job Holders Cannot Account For Most Of CES-CPS Discrepancy
The Household-Establishment Surveys Job Creation Conundrum


Comments
Log in or sign up to join the conversation.