
Monthly Market Update
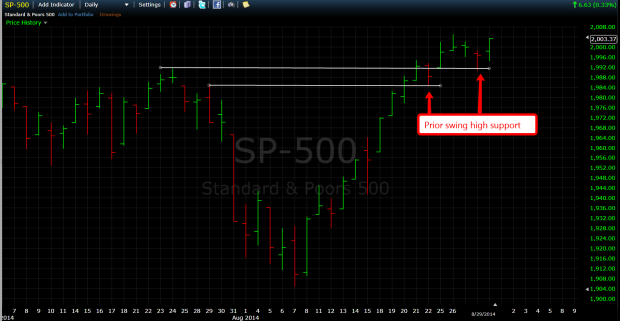
Stocks closed the month strong, as the benchmark S+P 500 index gained almost 4% for the month of August and closed the month above the psychological level that is 2000. The daily chart above highlights how the last two minor retracements have both found support at the previous highs formed back in July (a bullish technical picture).
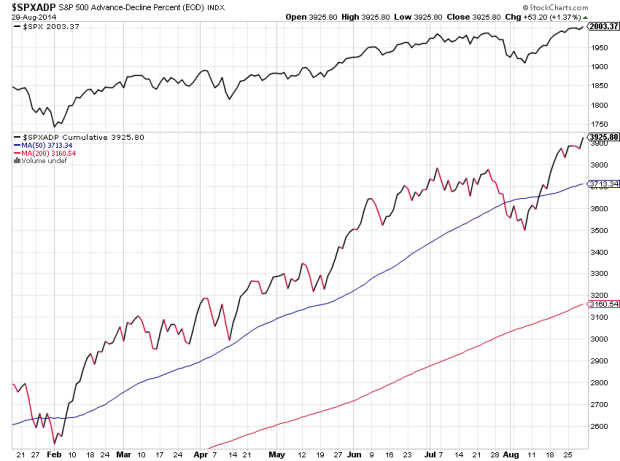
The cumulative advance – decline line shows an equally bullish technical picture also. As the reading’s continue to climb to new highs well above the previous, signaling a broad index participation rate necessary for continuation of rallies.
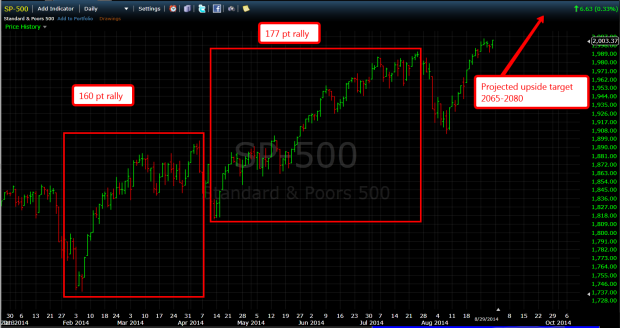
Now no one knows what the future holds, with any certainty, but what I find most helpful is to simply examine the previous technical patterns and attempt to align myself with them until or unless they fail. The daily chart of the S+P 500 above shows the previous two advances. The second rally came after an 80 point decline, just like the one we experienced earlier this month. These market rallies took the benchmark index up between 160 and 177 points, so we can simply add those amounts to the August swing low to come up with a projected upside target in the area of 2065-2080 on the S+P 500.
Now you will no doubt here a lot of “noise” about how September is historically a weak month for market returns. However I find this data is just that, “noise”, and nothing more. In fact, other than 2011, September has been a pretty good month for market returns over the last few years. This doesn’t mean that September couldn’t turn into a dismal month, it could. It just means this information at face value does nothing to help investors, much like the “sell in May” anecdote, it is just an overall market observation that doesn’t take into account any recent market data. Use these slogans and seasonality patterns sparingly, if at all.
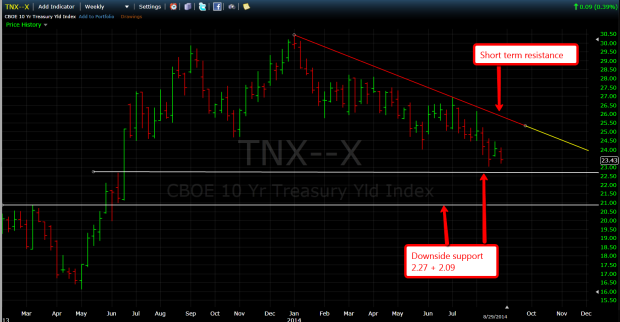
One of the biggest surprises in 2014 has to be the performance of Treasury bonds. Interest rates, which everyone predicted would be much higher by now, are at levels last seen over a year ago. I’m suspecting downside support is close at hand. The 2.27 level and the 2.09 level is one I am watching very closely. Rates would need to, at the very least, take out the trend line resistance above before anticipating the potential of a short squeeze. It’s likely to get very interesting over the next few months at what direction rates head.
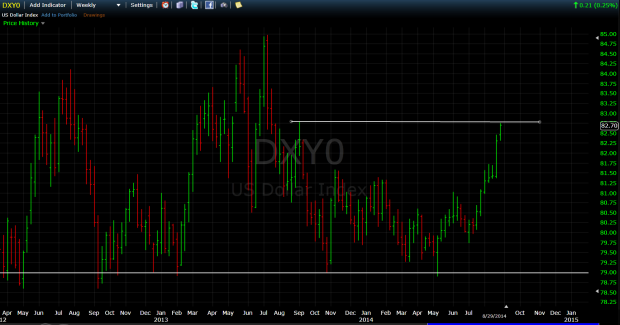
Lastly it’s nice to see the US Dollar getting a bid these days. Although the long term chart remains depressed, the short term shows USD reaching levels not seen since July of 2013. I suspect the minor swing high at 82.78 will come in as a key level going forward. Support stands around 81.75.
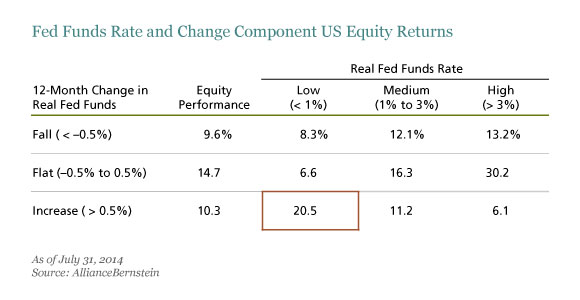
So as uncertainty about the future changes to monetary policy and geopolitical events continue to stay at the forefront of everyone’s mind. We also see a stock market that will not quit and corporate profits continuing their upward momentum. I will leave you with this excellent chart by AllianceBernstein that shows the US equity returns during changes in the Fed funds rate. Everyone is quite nervous about this upcoming interest rate hike, but the data actually shows small incremental increases from below average levels aren’t nearly as scary as many believe.
None.


