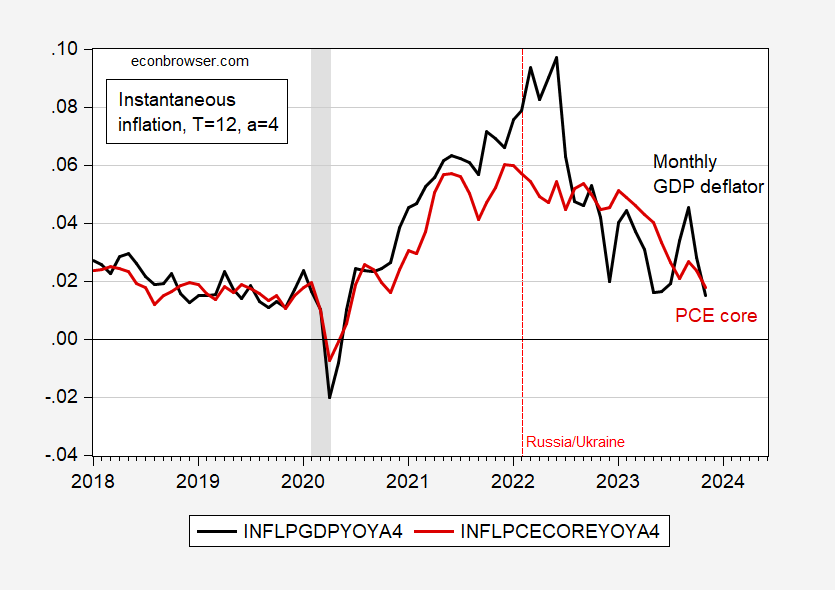
Monthly GDP Instantaneous Inflation Vs. Core PCE

Image Source: Pexels
GDP at 1.5%, PCE at 1.8%.

Figure 1: Instantaneous inflation (T=12, a=4) for monthly GDP deflator (black), core PCE (red), per Eeckhout (2023). NBER defined peak-to-trough recession dates shaded gray. Source: S&P Global Market Insights, BEA, NBER and author’s calculations.
More By This Author:
Still Waiting For The Recession, Weekly Data Through 12/30Is Velocity Stable? Part MXXVI
Business Cycle Indicators At The Start Of 2024
Disclaimer: This information is presented for informational purposes only and does not constitute an offer to sell, or the solicitation of an offer to buy any investment products. None of the ...
moreComments
Please wait...
Comment posted successfully
No Thumbs up yet!


