
And other NBER BCDC indicators.
(Click on image to enlarge)
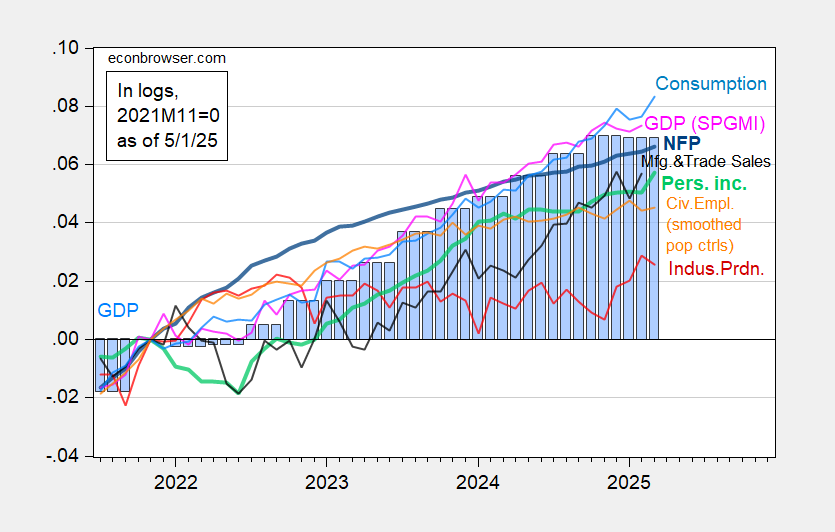
Figure 1: Nonfarm Payroll incl benchmark revision employment from CES (bold blue), implied NFP from preliminary benchmark through December (thin blue), civilian employment as reported (orange), industrial production (red), personal income excluding current transfers in Ch.2017$ (bold light green), manufacturing and trade sales in Ch.2017$ (black), consumption in Ch.2017$ (light blue), and monthly GDP in Ch.2017$ (pink), GDP (blue bars), all log normalized to 2021M11=0. 2025Q1 GDP is advance release. Source: BLS via FRED, Federal Reserve, BEA, S&P Global Market Insights (nee Macroeconomic Advisers, IHS Markit) (4/1/2025 release), and author’s calculations.
Personal income up in March suggests no slowdown yet; consumption surge might be driven by front-loading due to tariffs (suggested by durables uptick).
First reading on April in tomorrow’s employment numbers. Bloomberg consensus for NFP at +133K.
More By This Author:
Economy Stumbles Into 2025100 Day Marker: Economic Optics Not Great
A Timeline For Recession?


Comments
Log in or sign up to join the conversation.