

Image Source: Pexels
With latest available data:
(Click on image to enlarge)
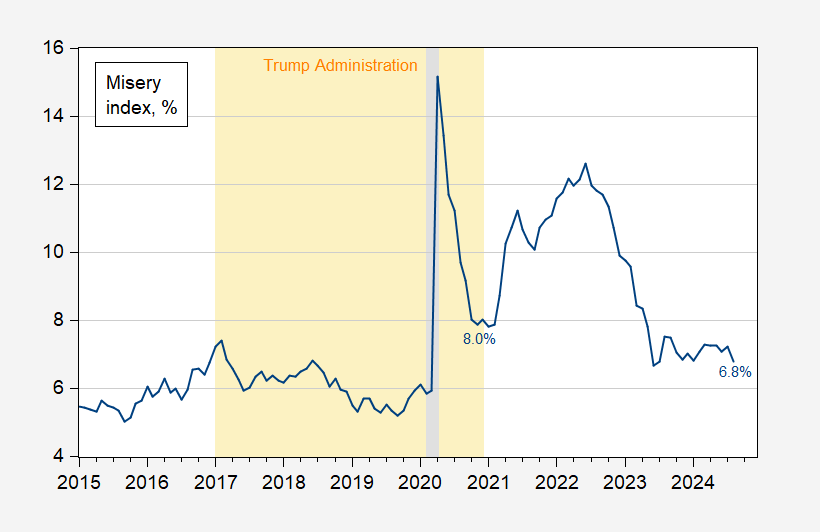
Figure 1: Misery Index, calculated as simple sum of unemployment rate and 12 month CPI inflation rate. NBER defined peak-to-trough recession dates shaded gray. Source: BLS via FRED, NBER, and author’s calculations.
Note that Misery was 9.7% in 2020M08, exactly 4 previous to August 2024 reading.
More By This Author:
Business Cycle Indicators – August 2024 And Annual UpdatesDecomposing The Revision To GDO
Diffusion Indexes For August


Comments
Log in or sign up to join the conversation.