Mid-October Reading On Business Cycle Indicators – NBER BCDC And Alternatives
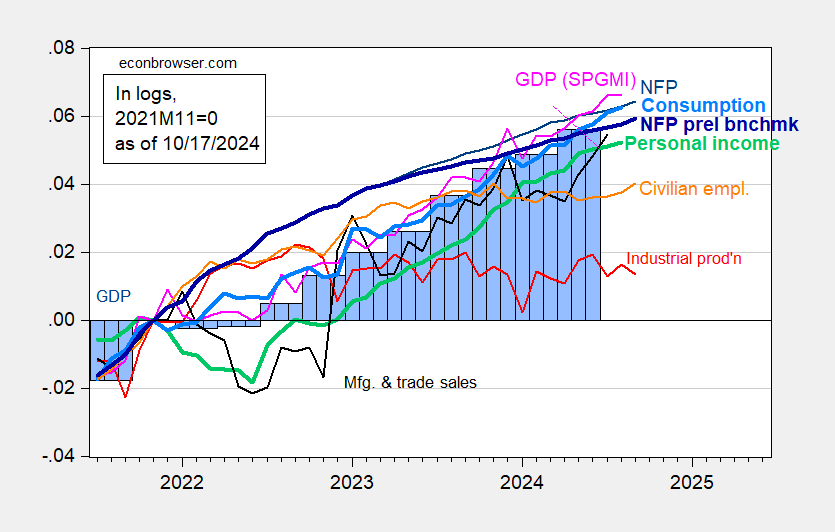
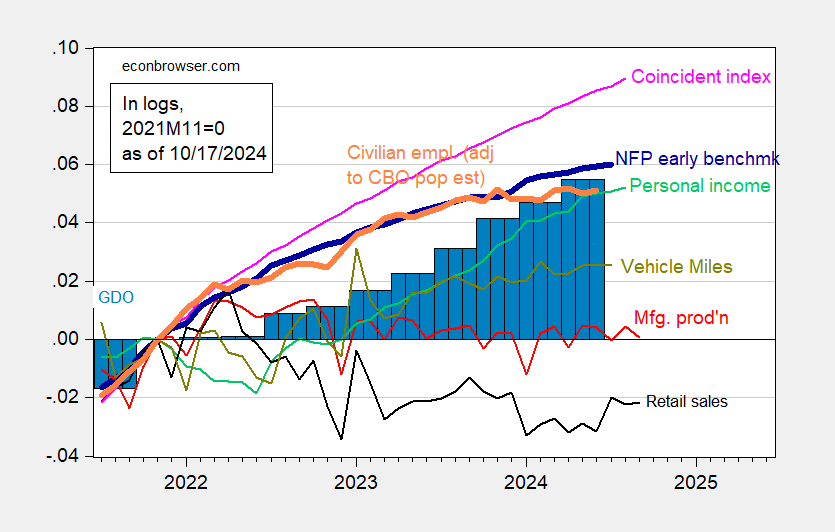
Industrial and manufacturing production below consensus (-0.3% m/m vs -0.1%, -0.4% vs -0.1%, respectively), while retail sales and core retail sales above consensus (+0.4% m/m vs +0.3%, +0.5% vs +0.1%, respectively). Here’s the resulting two pictures, first one for those indicators followed by the NBER BCDC, and the second one alternatives.
(Click on image to enlarge)

Figure 1: Nonfarm Payroll (NFP) employment from CES (blue), implied NFP from preliminary benchmark (bold blue), civilian employment (orange), industrial production (red), personal income excluding current transfers in Ch.2017$ (bold light green), manufacturing and trade sales in Ch.2017$ (black), consumption in Ch.2017$ (light blue), and monthly GDP in Ch.2017$ (pink), GDP (blue bars), all log normalized to 2021M11=0. Source: BLS via FRED, Federal Reserve, BEA 2024Q2 3rd release/annual update, S&P Global Market Insights (nee Macroeconomic Advisers, IHS Markit) (10/1/2024 release), and author’s calculations.
(Click on image to enlarge)

Figure 2: Nonfarm Payroll early benchmark (NFP) (bold blue), civilian employment adjusted using CBO immigration estimates through mid-2024 (orange), manufacturing production (red), personal income excluding current transfers in Ch.2017$ (light green), retail sales in 1999M12$ (black), vehicle miles traveled (chartreuse), and coincident index (pink), GDO (blue bars), all log normalized to 2021M11=0. Early benchmark is official NFP adjusted by ratio of early benchmark sum-of-states to CES sum of states. Source: Philadelphia Fed, Federal Reserve via FRED, BEA 2024Q2 third release/annual update, and author’s calculations.
Industrial production (which includes mining and utilities as well as manufacturing) is the only index which looks obviously in decline in September. Real retails sales are flat.
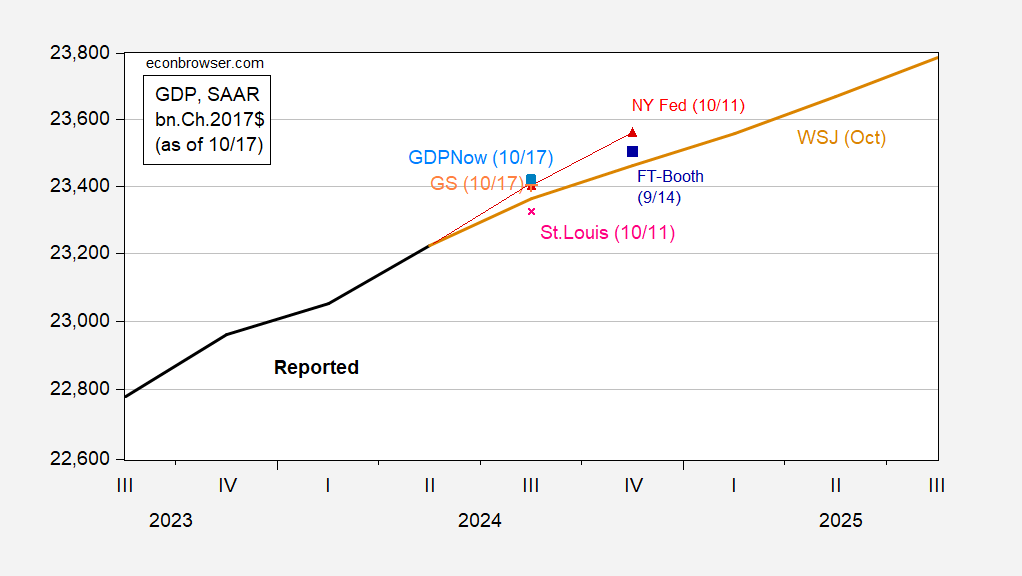
Q3 GDPNow is moved up from 3.2% q/q AR on 10/9 to 3.4% as of today. Combined with GS tracking and WSJ October survey, we have the following picture.
(Click on image to enlarge)

Figure 3: GDP (bold black), WSJ October survey mean (tan), GDPNow as of 10/17 (light blue square),NY Fed nowcast as of 10/11 (red triangles),St Louis Fed news nowcast as of 10/11 (pink x), Goldman Sachs tracking as of 10/17 (green +), FT-Booth as of 9/14 iterated off of 3rd release (blue square), all in bn.Ch.2017$ SAAR. Levels calculated by iterating growth rate on levels of GDP, except for Survey of Professional Forecasters. Source: BEA 2024Q2 3rd release, Atlanta Fed, NY Fed, Philadelphia Fed, WSJ October survey, and author’s calculations.
As noted in yesterday’s post, nowcasts (except St. Louis) appear to be outpacing the most recent survey, from WSJ.
The Lewis-Mertens-Stock WEI for data available as of 10/12 is at 2.0%, down from 2.22% for data through 10/5.
It is hard to see a recession in the currently available data as of September.
More By This Author:
Fed Inflation Credibility MeasuredWSJ October Survey: GDP On The Rise
Why So Glum? Sentiment By Partisan Grouping


