
The September Final Report came in at 58.6, up 0.4 (0.7%) from the July Final. Investing.com had forecast 59.5. Since its beginning in 1978, consumer sentiment is 31.5 percent below the average reading (arithmetic mean) and 30.7 percent below the geometric mean.
Surveys of Consumers chief economist, Richard Curtin, makes the following comments:
Consumer sentiment confirmed the preliminary reading earlier this month and was essentially unchanged from the month prior, at less than one index point above August. Buying conditions for durables and the one-year economic outlook continued lifting from the extremely low readings earlier in the summer, but these gains were largely offset by modest declines in the long run outlook for business conditions. As seen in the chart, sentiment for consumers across the income distribution has declined in a remarkably close fashion for the last 6 months, reflecting shared concerns over the impact of inflation, even among higher-income consumers who have historically generated the lion's share of spending.
The median expected year-ahead inflation rate declined to 4.7%, the lowest reading since last September. At 2.7%, median long run inflation expectations fell below the 2.9-3.1% range for the first time since July 2021. Inflation expectations are likely to remain relatively unstable in the months ahead, as consumer uncertainty over these expectations remained high and is unlikely to wane in the face of continued global pressures on inflation. [More...]
See the chart below for a long-term perspective on this widely watched indicator. Recessions and real GDP are included to help us evaluate the correlation between the Michigan Consumer Sentiment Index and the broader economy.
(Click on image to enlarge)
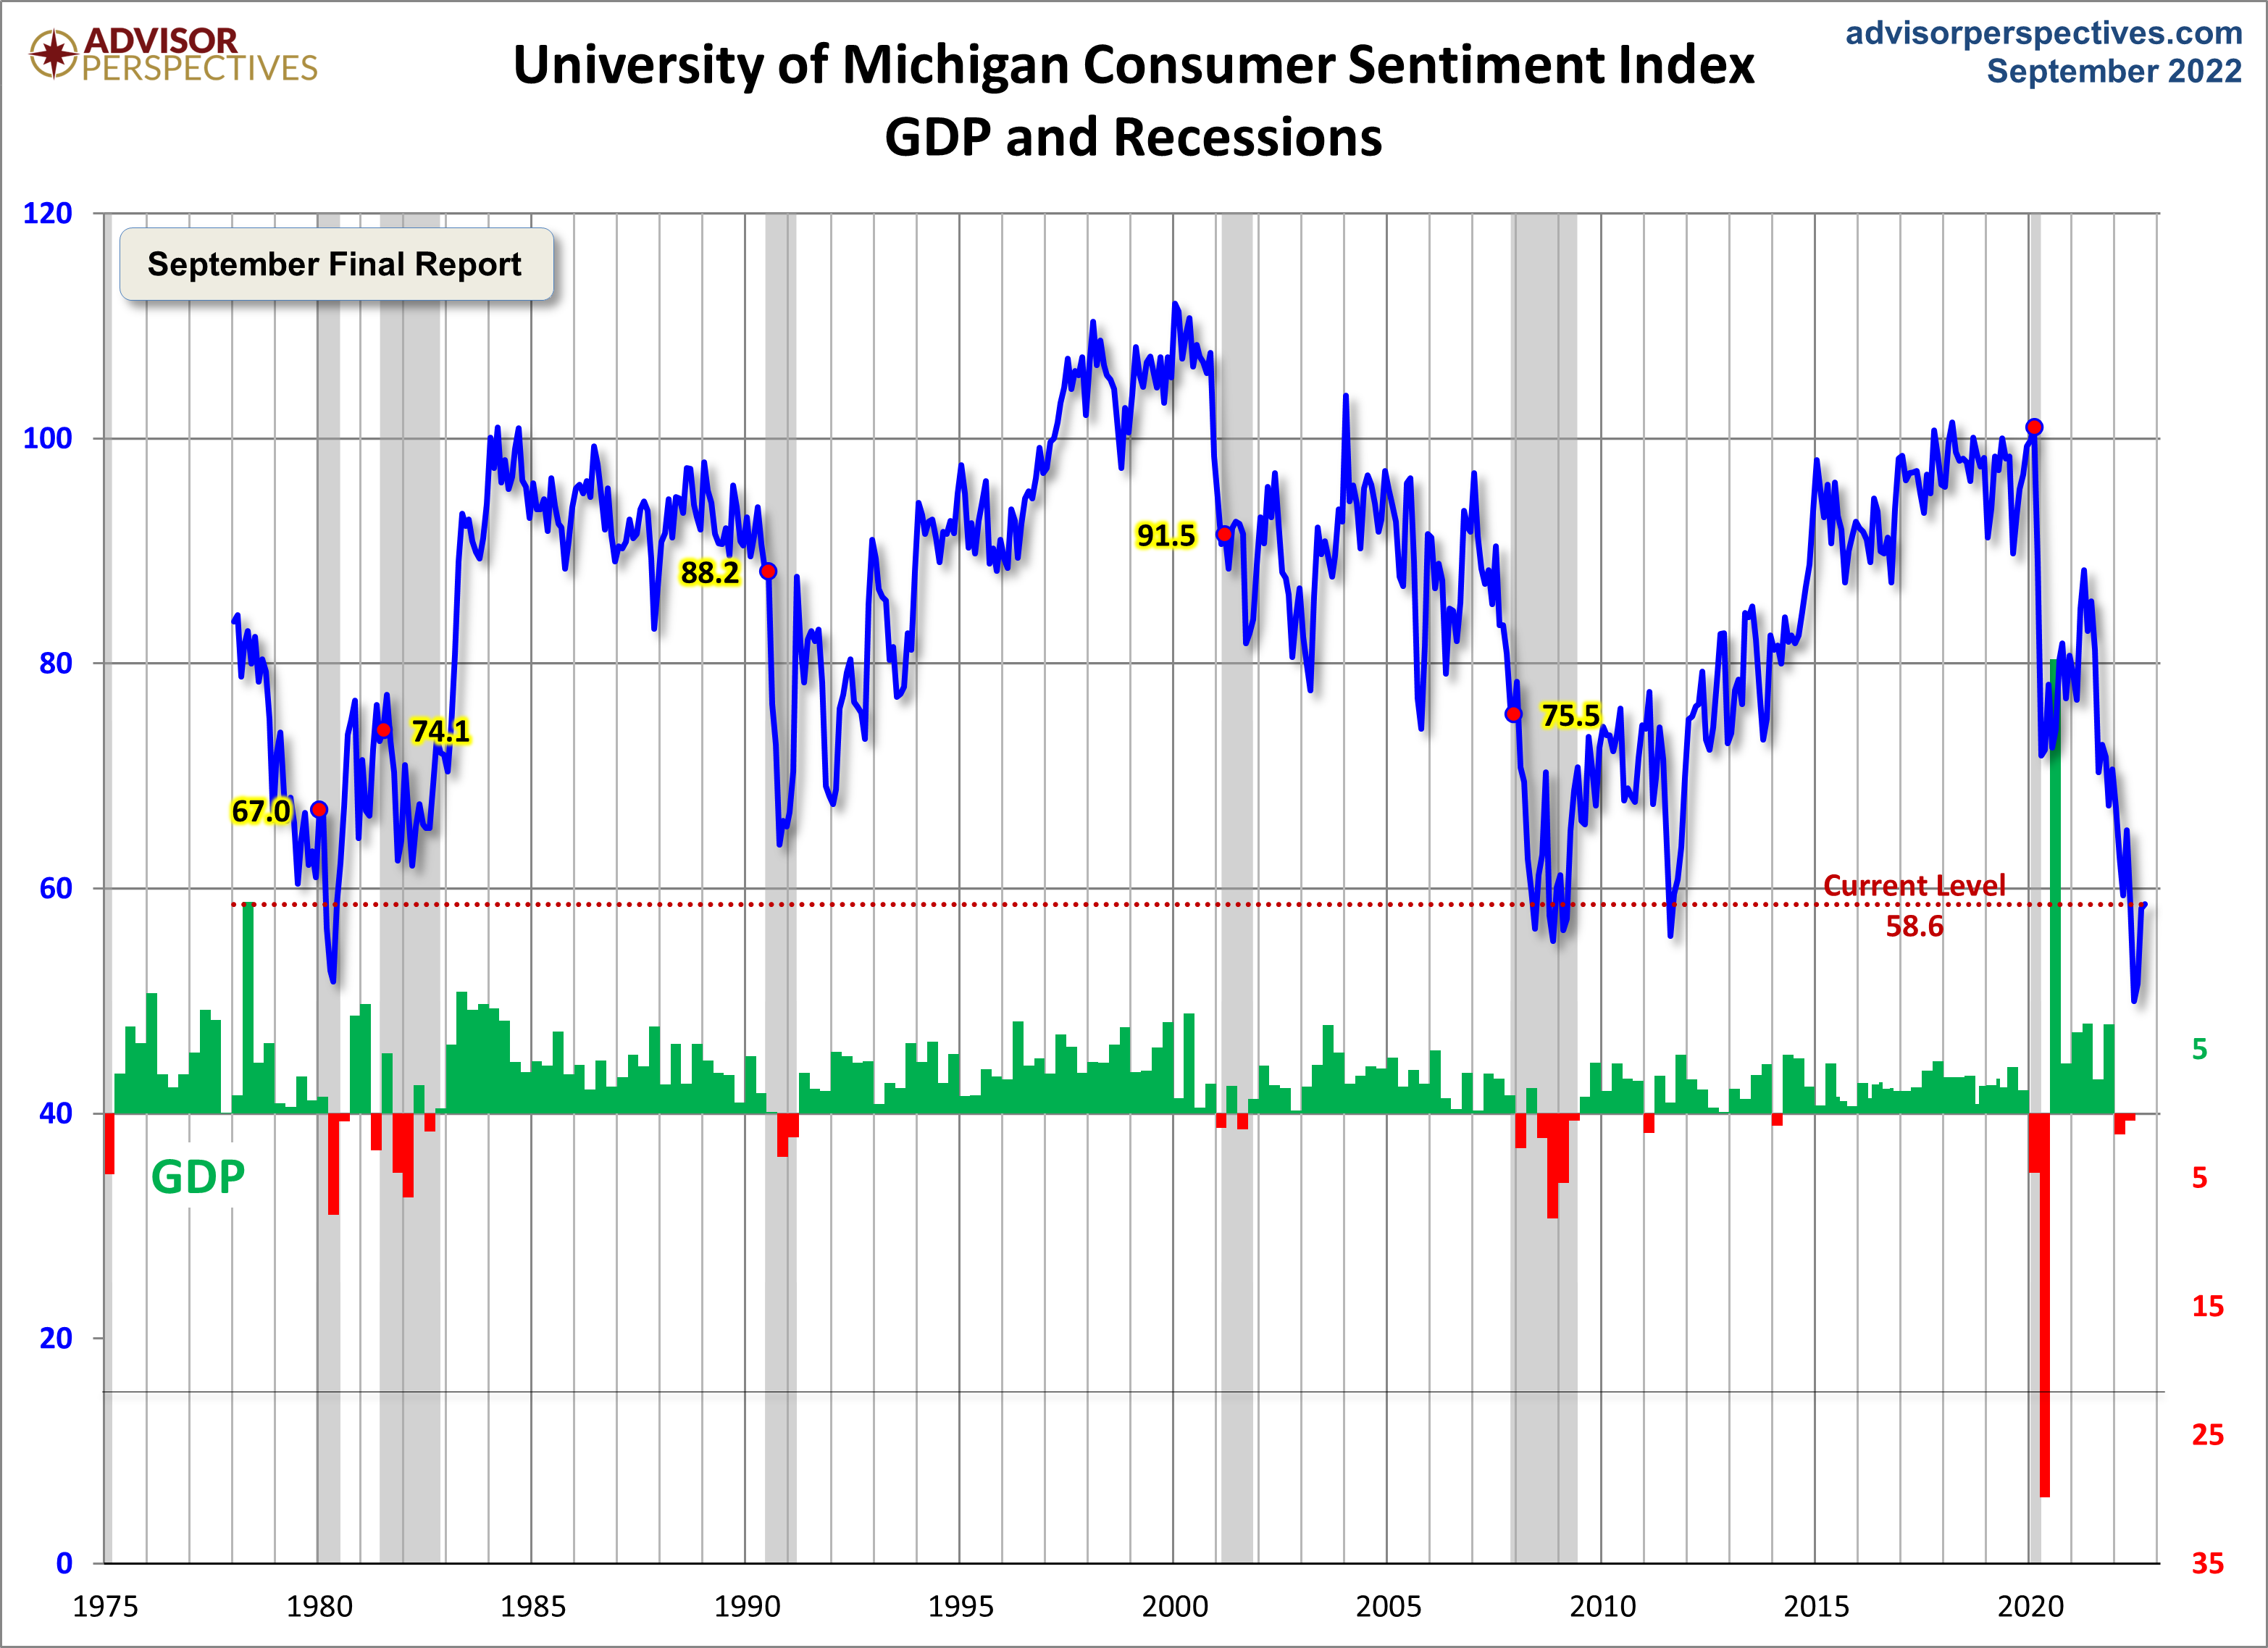
To put today's report into the larger historical context since its beginning in 1978, consumer sentiment is 31.5 percent below the average reading (arithmetic mean) and 30.7 percent below the geometric mean. The current index level is at the 2nd percentile of the 537 monthly data points in this series.
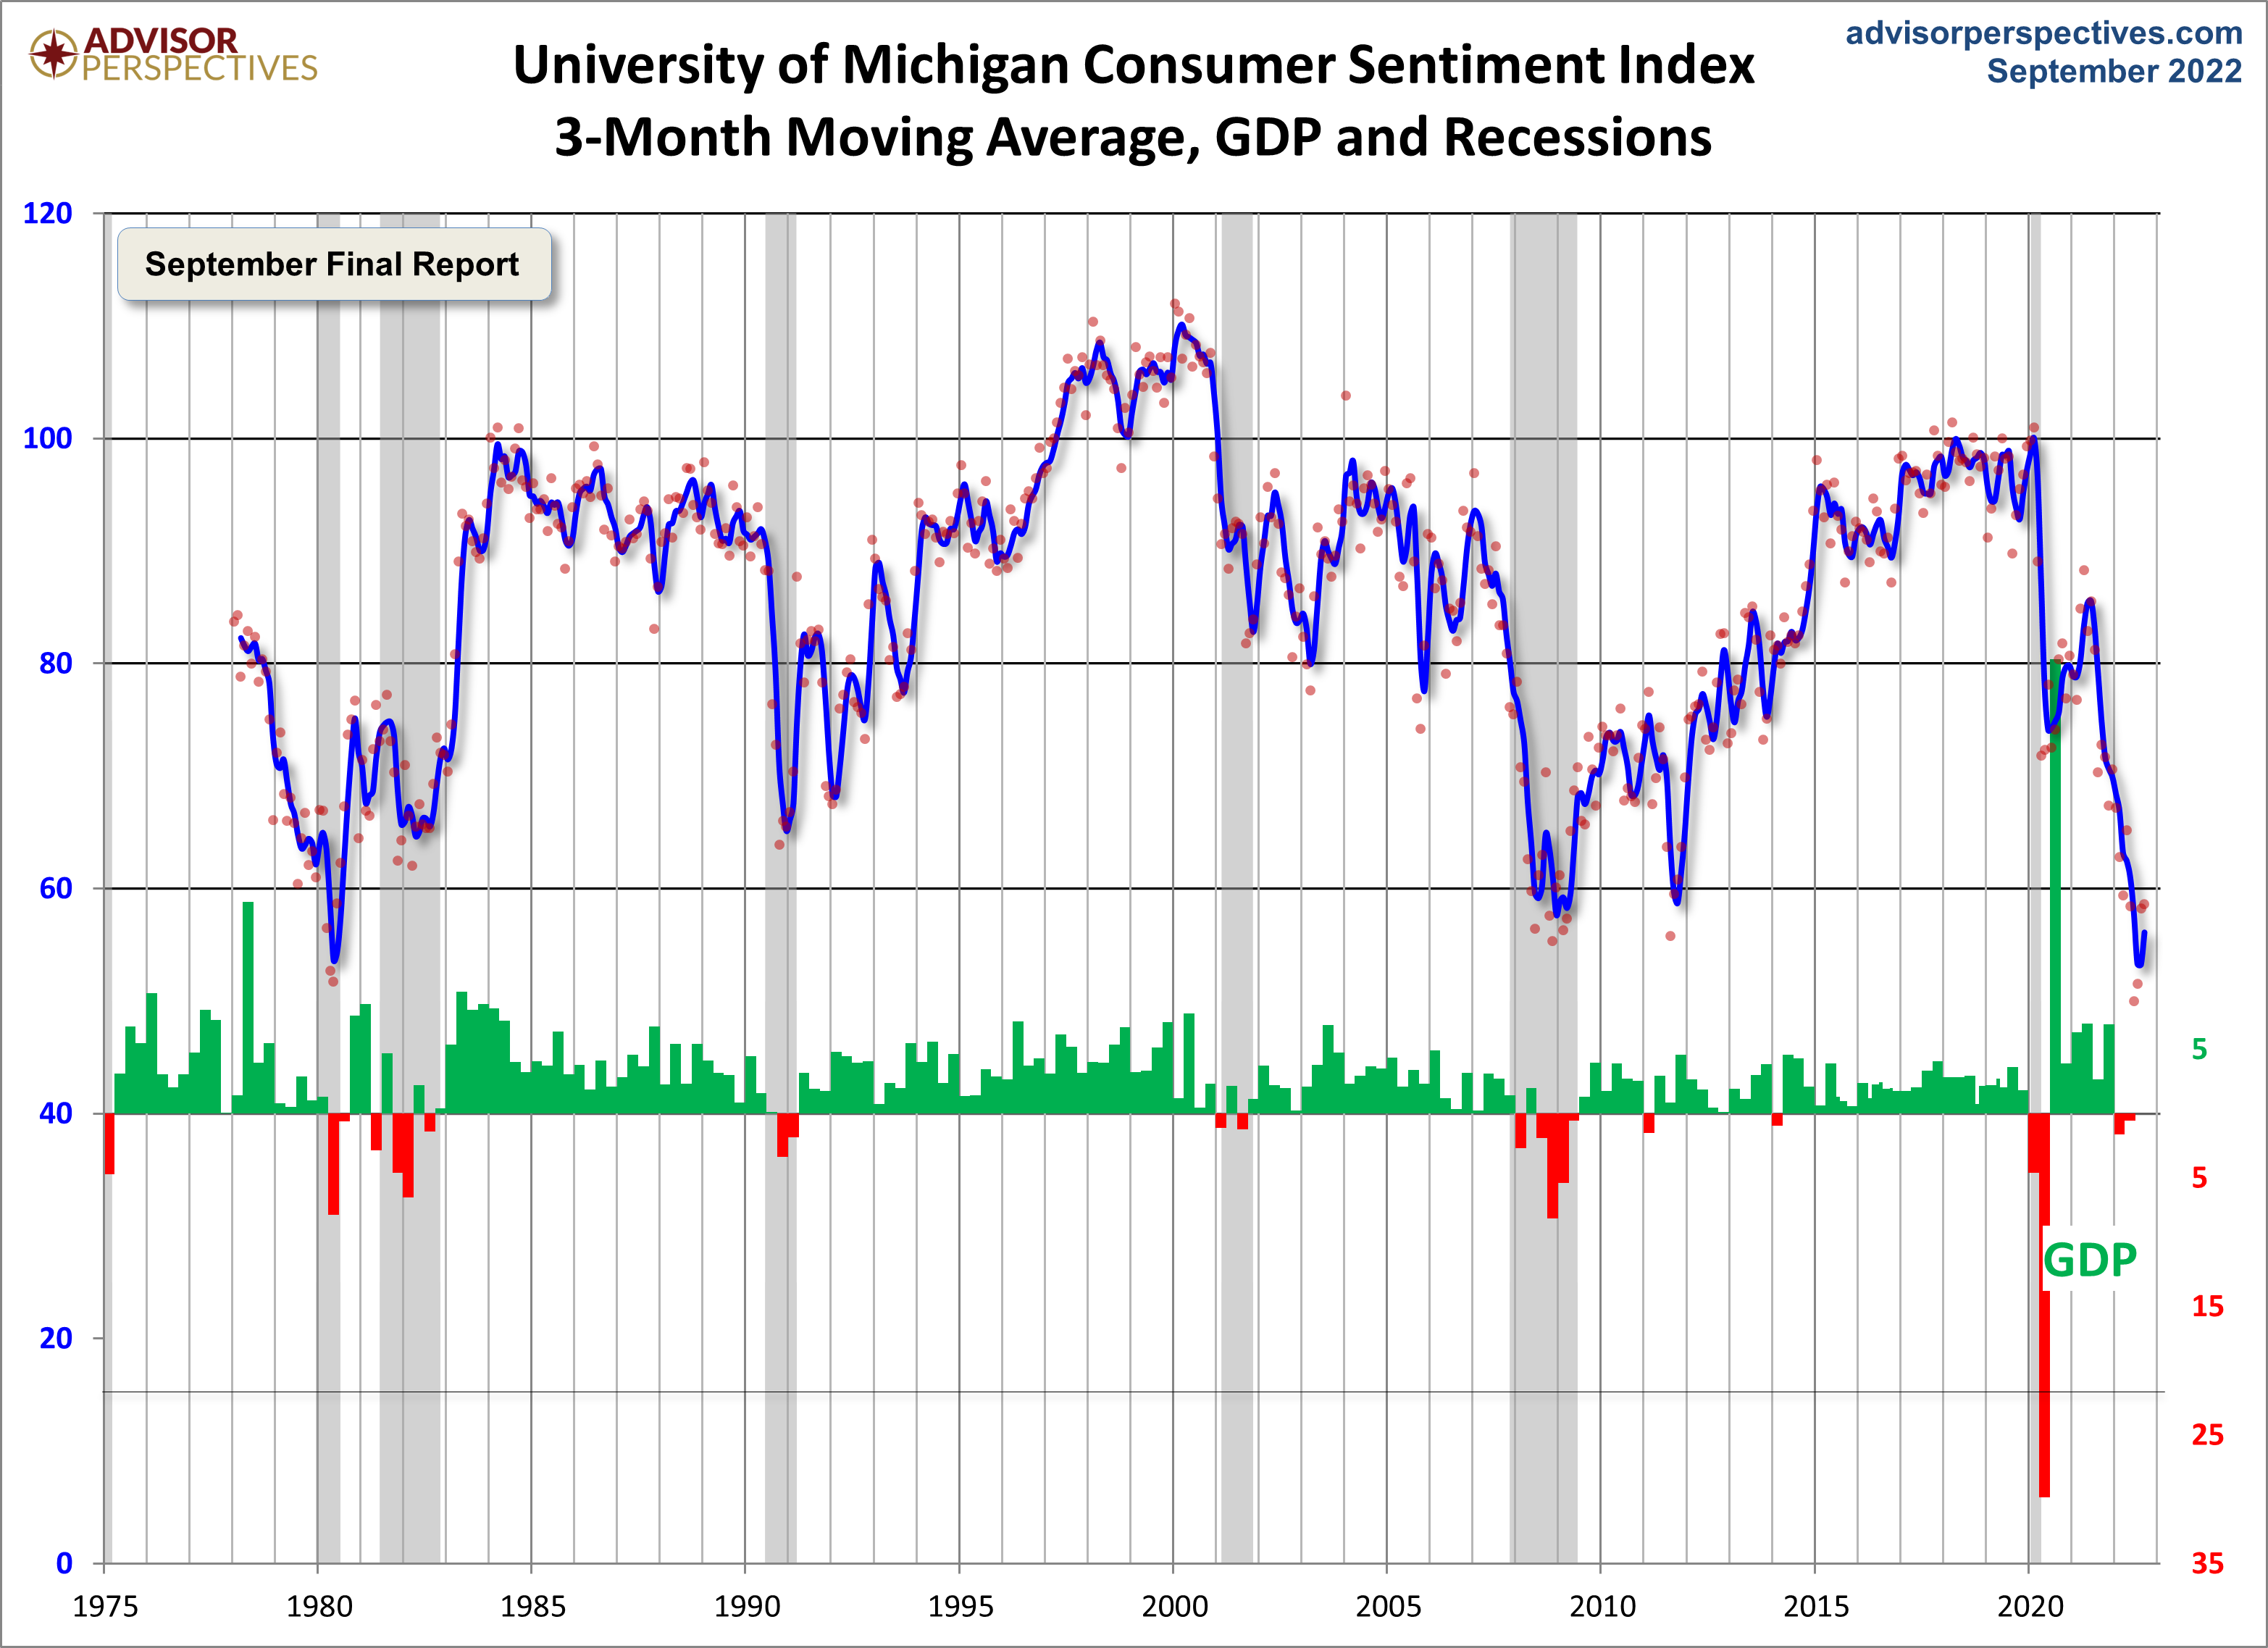
Note that this indicator is somewhat volatile, with a 3.0 point absolute average monthly change. The latest data point saw a 0.4 point increase from the previous month. For a visual sense of the volatility, here is a chart with the monthly data and a three-month moving average.
(Click on image to enlarge)
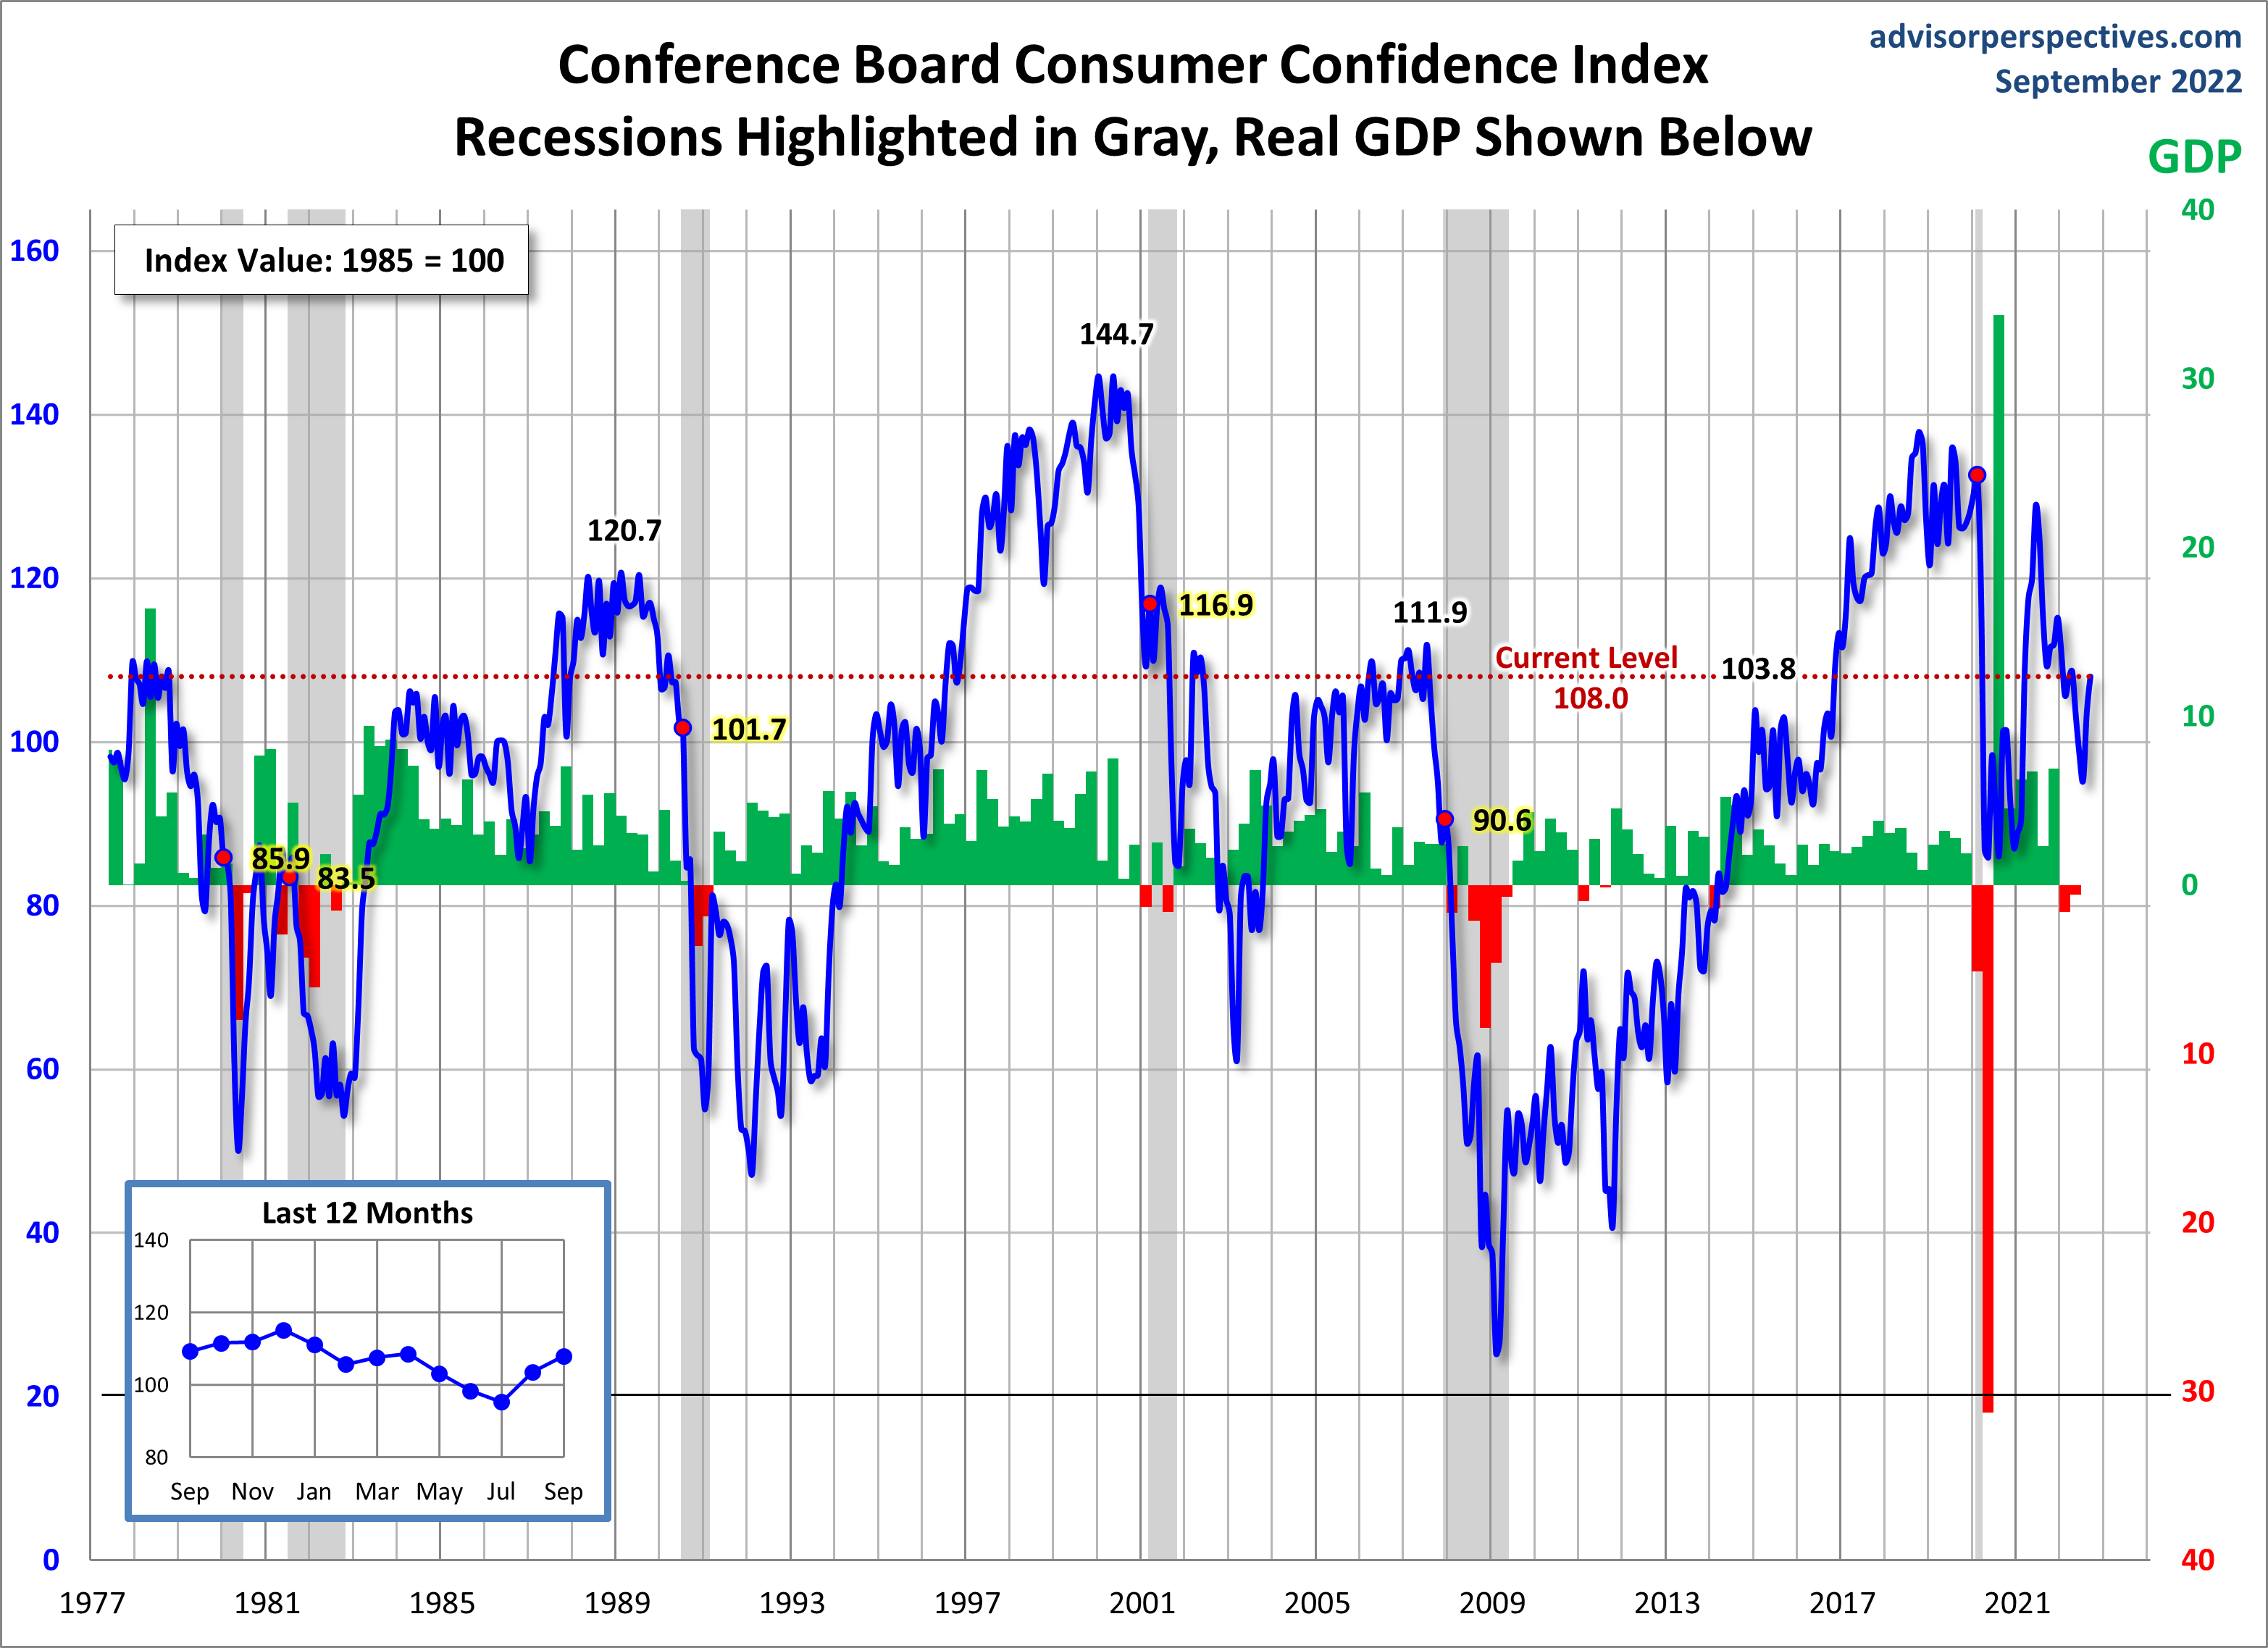
For the sake of comparison, here is a chart of the Conference Board's Consumer Confidence Index (monthly update here). The Conference Board Index is the more volatile of the two, but the broad pattern and general trends have been remarkably similar to the Michigan Index.
(Click on image to enlarge)
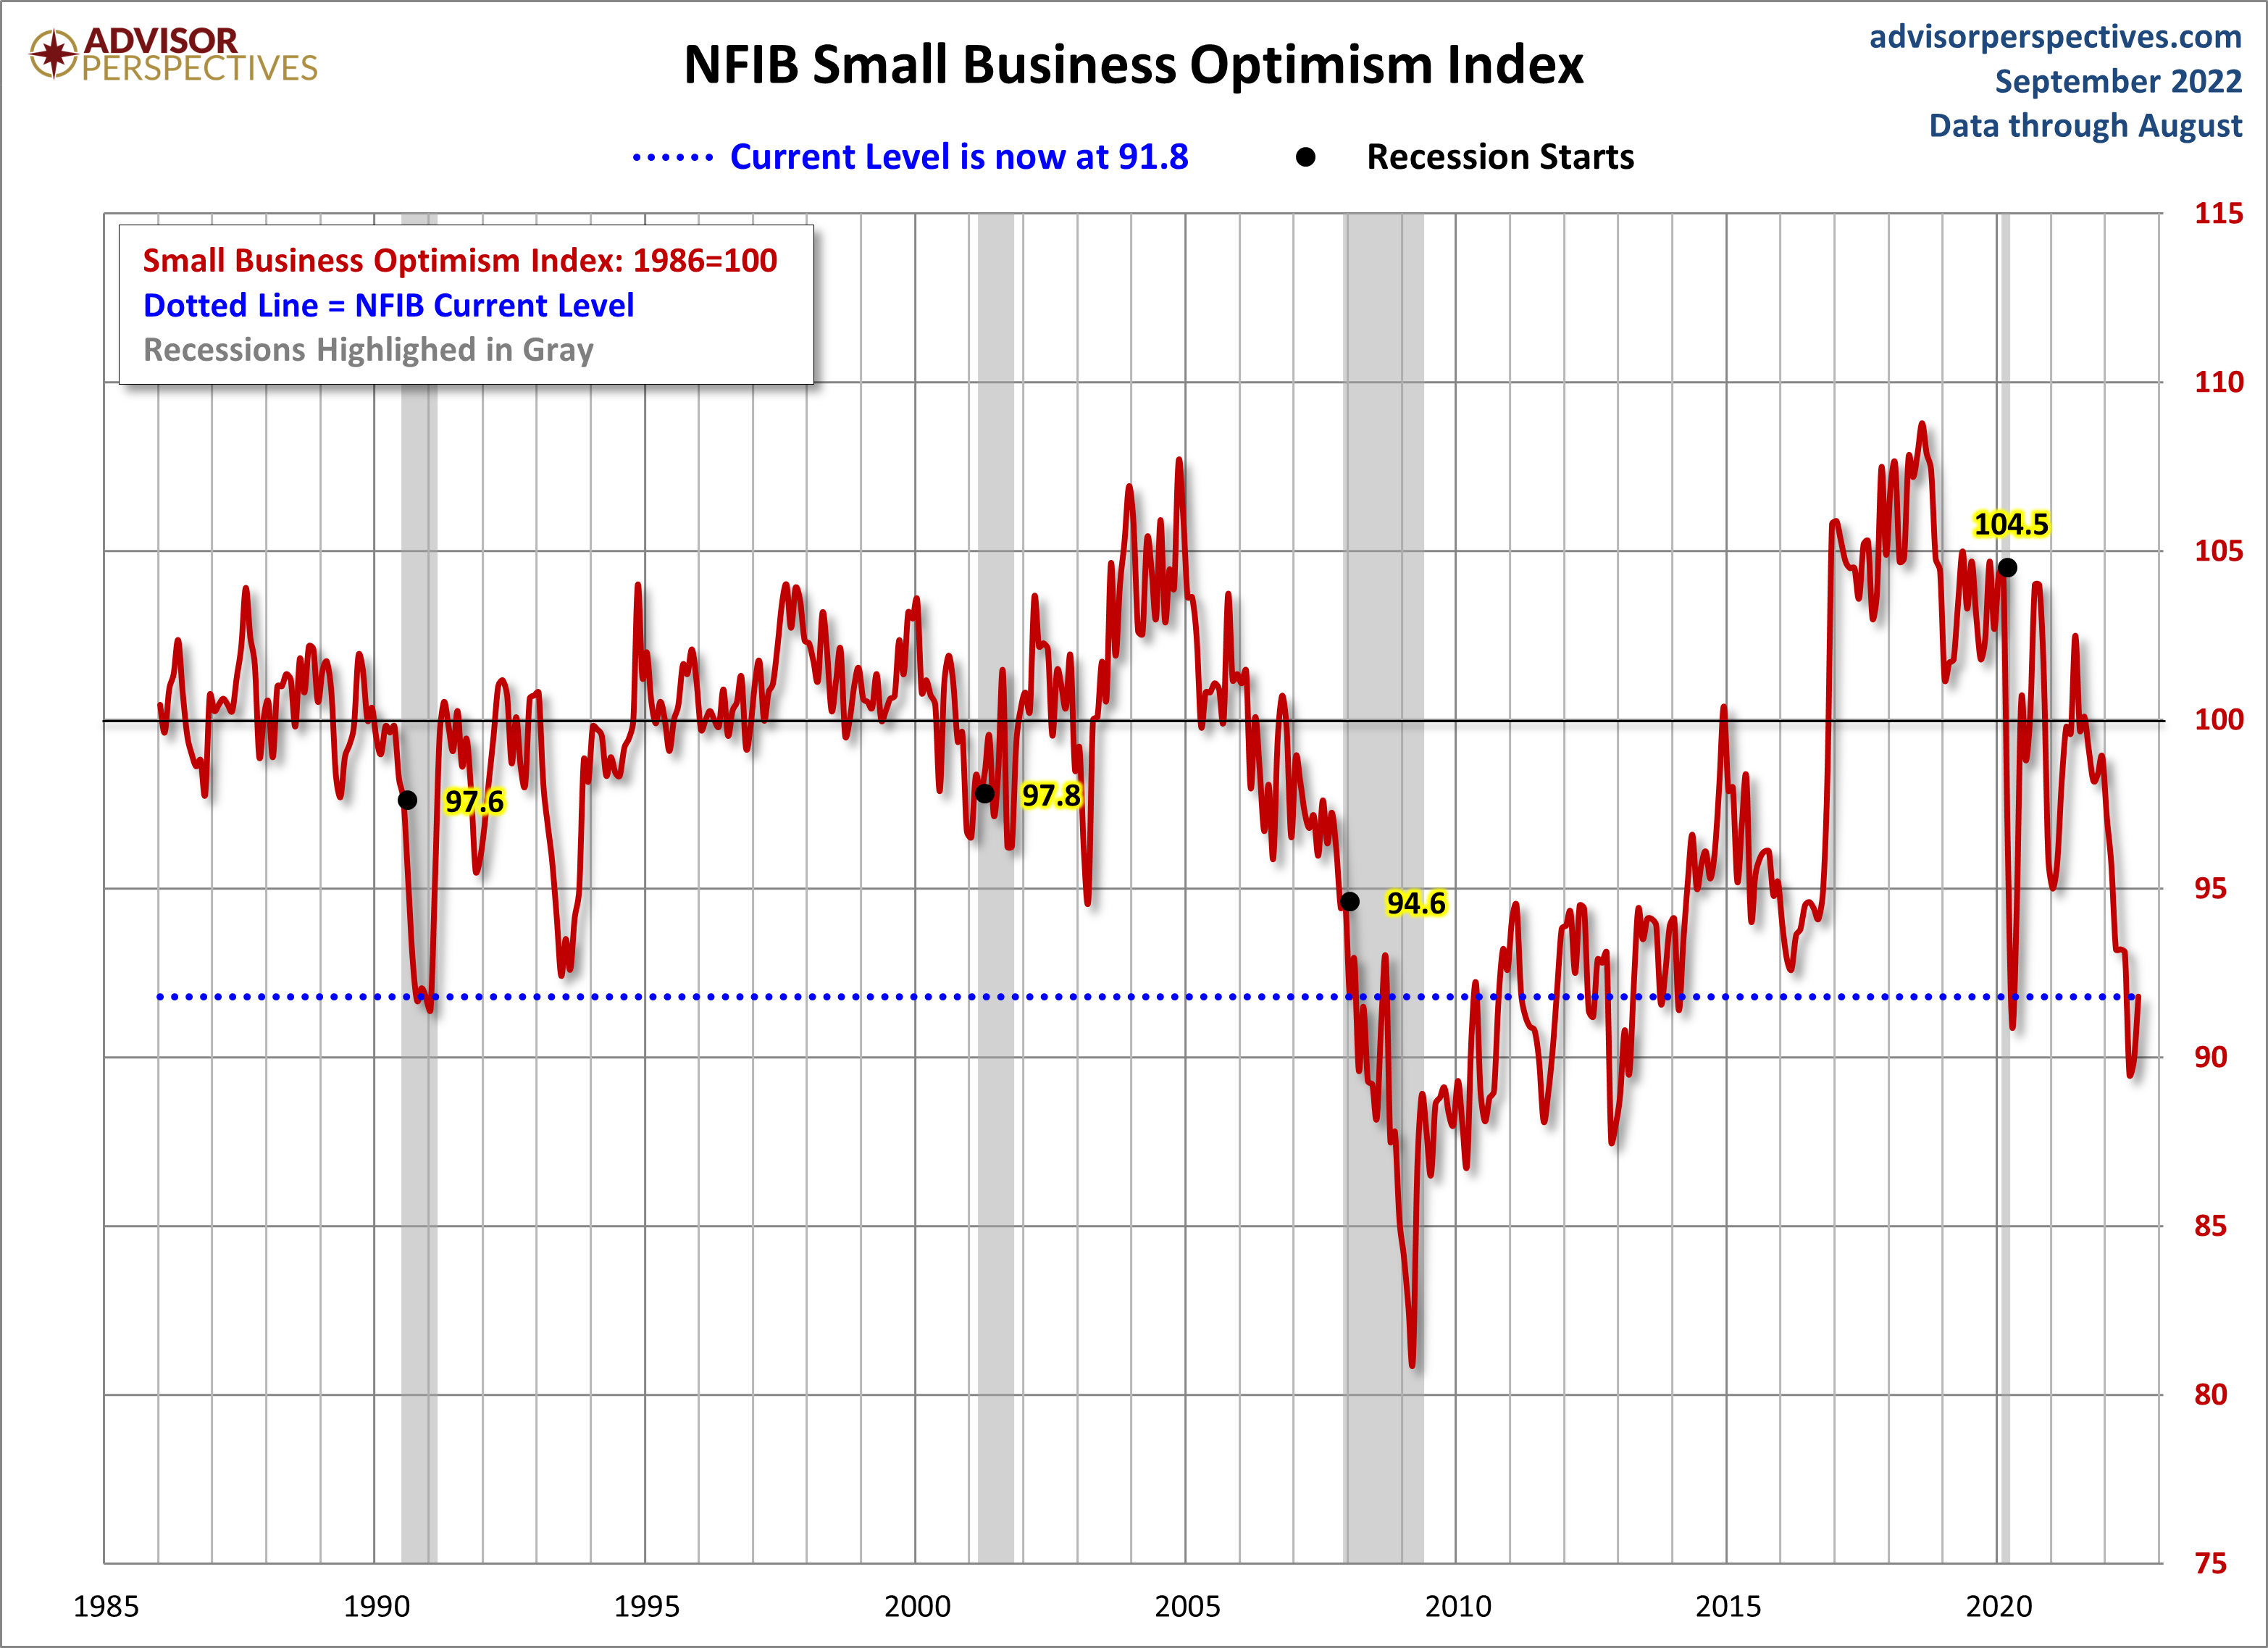
And finally, the prevailing mood of the Michigan survey is also similar to the mood of small business owners, as captured by the NFIB Business Optimism Index (monthly update here).
(Click on image to enlarge)
More By This Author:
PCE Price Index: August Headline At 6.25% YoY
Q2 Real GDP Per Capita: -0.8% Versus The -0.6% Headline Real GDP
Q2 GDP Third Estimate: Real GDP At -0.6%, As Expected


Comments
Log in or sign up to join the conversation.