May SPF GDP Forecast
Continued growth (report):

Figure 1: GDP (bold black), May SPF median (light blue), GDPNow of 5/16 (blue square), New York Fed nowcast of 5/10 (green triangle), St. Louis Fed nowcast of 5/10 (tan square), all in bn.Ch.2017$, SAAR. Source: BEA 2024Q1 advance, Philadelphia Fed, Atlanta Fed, NY Fed, St. Louis Fed, and author’s calculations.
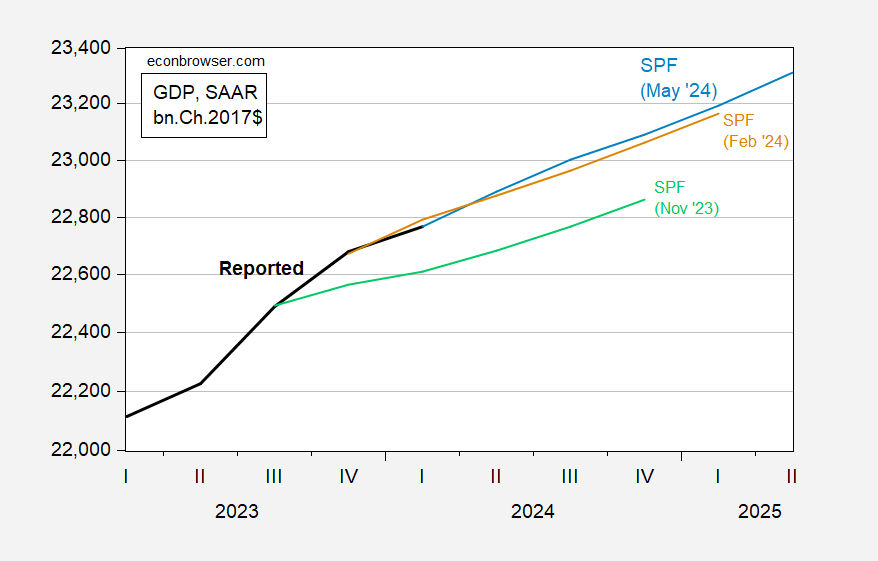
Unlike the Nov ’23 and Feb ’24 trajectories, the gap between the Feb ’24 and May ’24 is trivial.

Figure 2: GDP (bold black), May SPF median (light blue), February (tan), November 2023 (light green), all in bn.Ch.2017$, SAAR. Source: BEA 2024Q1 advance, Philadelphia Fed,and author’s calculations.
More By This Author:
Import Prices SurpriseBusiness Cycle Indicators Mid-May
The Trend Break In CPI
Comments
Please wait...
Comment posted successfully
No Thumbs up yet!


