

Welcome back, readers. Thank you for a few minutes of your time to uncover some important takeaways on the markets and the economy. While we cannot accurately prognosticate what the markets may do going forward, we have been on the “right side” of our observations and suggestions throughout 2024 in this weekly outlook.
Over the last two weeks, even with a negative market, we have provided plenty of reasons why you might want to stay on the long side of the market. These included impending economic softness (soft landing), unemployment increases, good-to-great earnings, election year influence, seasonal (July and August) positive historical periods, and optimism and momentum that have been driving the market.
We want to continue with this theme and provide notice that we are getting closer to September, an important National Election, and what many believe is a tenuous period for stocks. Let’s jump right in.
Good Economic Numbers and a "Soft Landing Narrative" Drove the Markets Higher This Past Week
You certainly will recall that as we took the turn from July to August, and with the release of important numbers like job growth, unemployment, and the ISM, stocks broke down (quickly) and the discussion on Wall Street pivoted to the potential for a recession. In fact, the first week of August, many economists were pontificating that the Fed needed to have an emergency meeting and lower rates immediately. So much for that narrative.
We were met with a quick pullback/correction (more on this shortly), and the markets turned on a dime two weeks ago before heading up. Our view these past few weeks was that much of this was driven by a liquidity shock crisis caused by large institutional managers and hedge funds who had to sell securities to meet margin calls from the yen carry trade. Surprisingly, many of them got adversely caught in this scenario after the Bank of Japan raised rates suddenly to offset their own revised growth and inflation.
Good Economic Numbers
Before we address just how good the stock markets did this past week (the best week of the year), we want to point out that much of the prior period's weakness was driven by investor concerns that the Federal Reserve wouldn’t reduce borrowing costs fast enough to keep the US economy out of a recession.
But new data this week showed ebbing inflation and a resilient and thriving consumer. These are the hallmarks of the Fed’s goal of a soft landing. The CPI came out and showed that the economy continues to cool down, which should motivate Jerome Powell and company to commence with a rate reduction schedule in September. See CPI illustration below which identifies the specific areas of the CPI that continue to decline/cool:
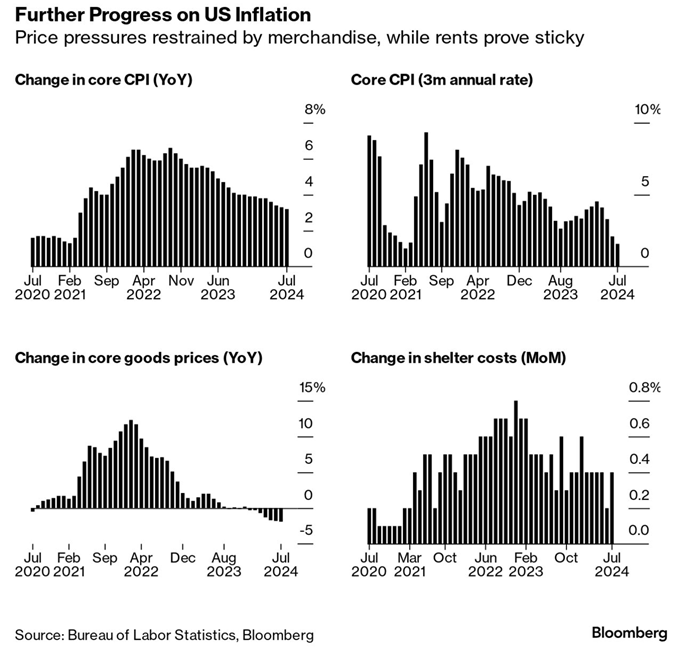
CPI
See chart below:

Consumer Sentiment Rebounds
This past week, we also received an update on the University of Michigan consumer sentiment index. The index jumped in August and surprised to the upside. It was the first increase in five months. Part of the surprise was the consumer expectation for 12-month inflation declining to the lowest level since December 2020.
On Friday, we received the numbers showing an unexpected rise in retail spending. The Commerce Department’s release of sales of US retailers in July rose by a solid 1% from the prior month. This is the backbone of America’s economy, and this proved that we are unlikely to enter a recession anytime soon.
This was welcome news, and it helped the S&P 500 surge to a new monthly high and into the green for August.
Two Important Sectors That Are Vital to the US Economy
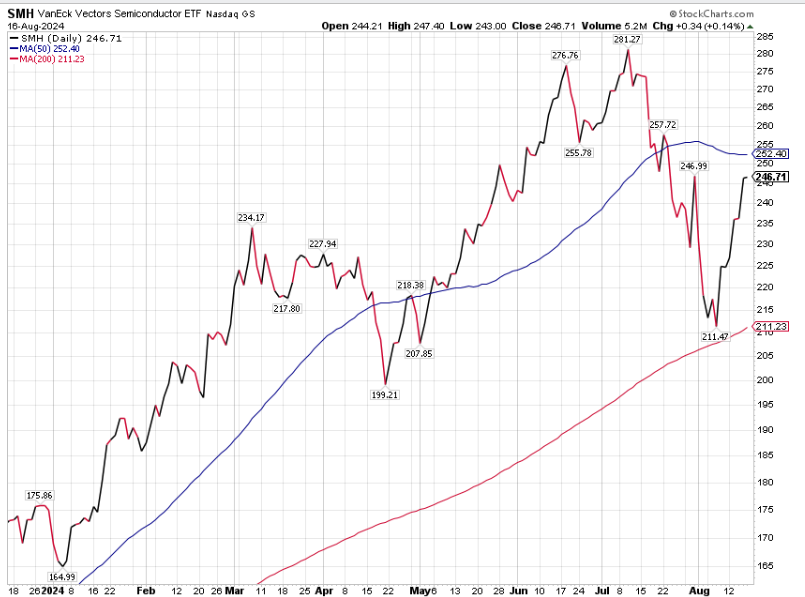
I always like to refer to Mish’s writings and the influence of each sector on the health of the economy and the markets. Two important spaces that often point to the health of the markets are Retail and Semiconductors. Below are two price charts for these sectors.
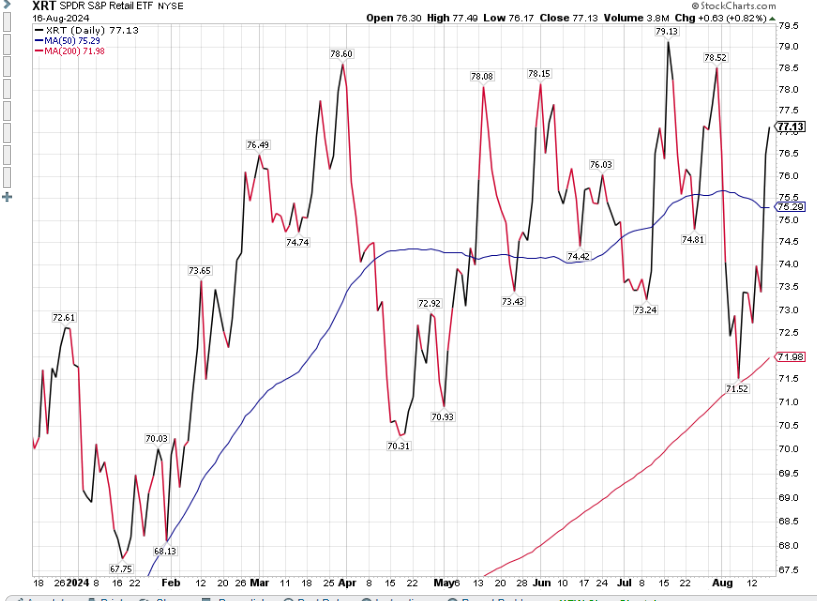
Notice the snap back this past week in the retail sector. While it has not made a new high for some time (actually moving sideways in a rectangle box), it continues to show the consumer’s resilience by staying above the 50- and 200-day moving averages.
A similar positive tale for semiconductor stocks can be seen below, although the price action remains below the 50-day moving average. More on the tech stock rebound in a minute.
The Markets
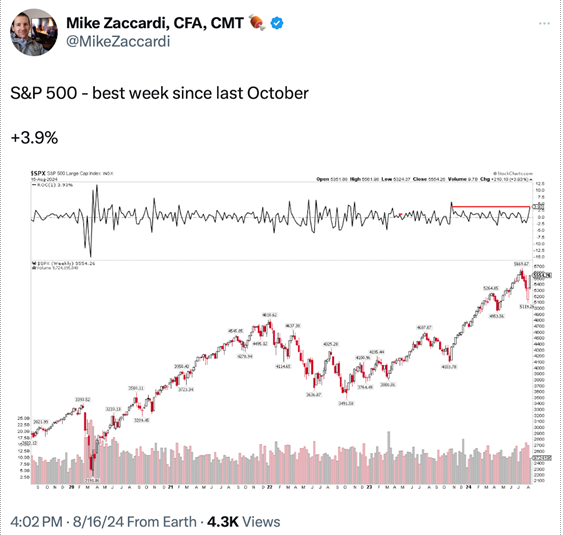
For the S&P 500, last week was a perfect time in the markets. Every day, the S&P 500 index closed up, with several very positive days seen. This resulted in the S&P 500’s best week since October 2023 (see chart below). As stated above, the S&P 500 is now positive for the month of August. This was after a quick and significant pullback (more on pullback vs. corrections shortly). See the illustrations of the S&P 500 below:
This week’s rally was not all about the S&P 500, as technology stocks were “slammed” and actually went into a correction that surged for the past six days. See the illustration below:
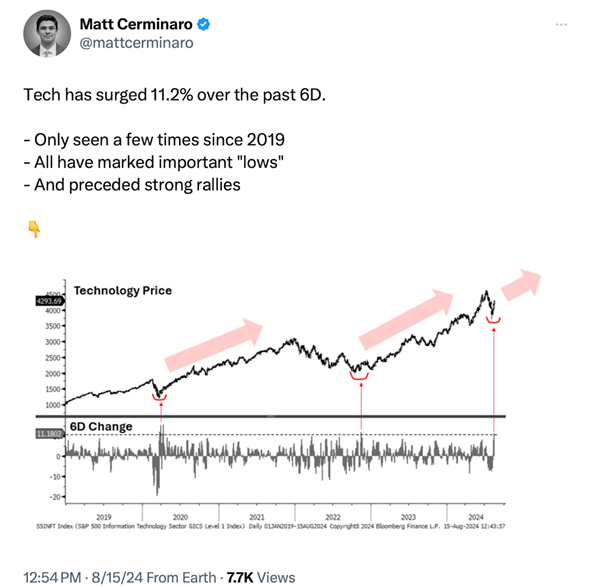
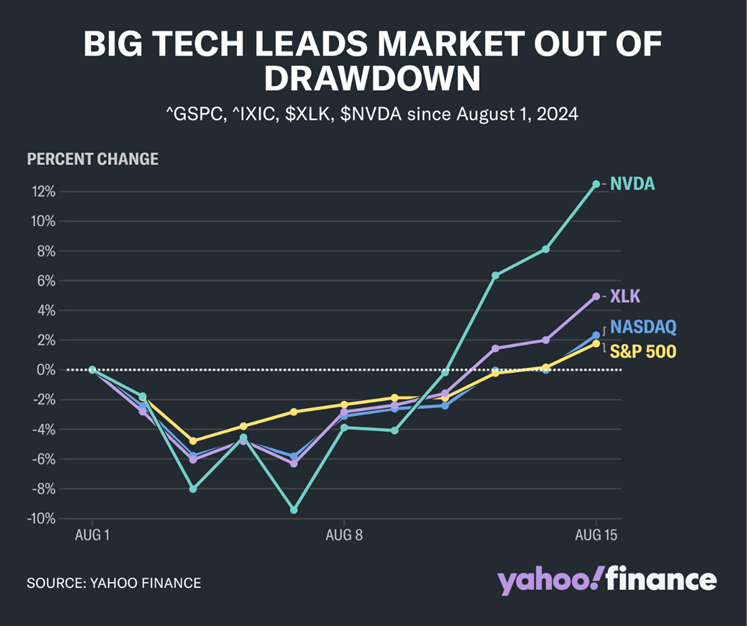
For the month of August, after being down over 10%, the mega-cap darlings of the 2024 markets rebounded and closed 12% higher for the month. Tech led much of the early August weakness back into positive territory. See chart below:
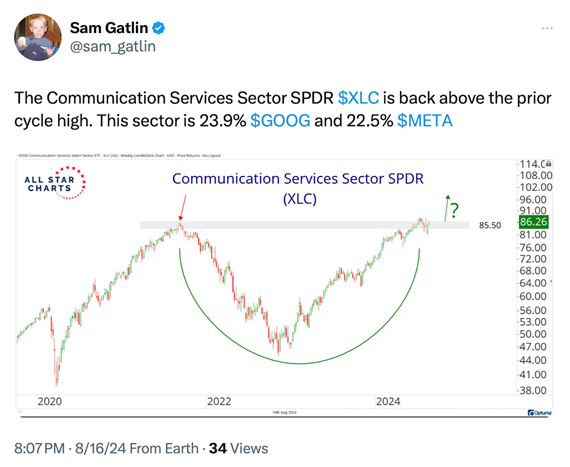
Besides tech stocks (shown above), another sector that has previously had a significant contribution to the S&P 500 was also a bright spot in the market last week. The communication sector showed strength from the consumer and helped the S&P 500 surge higher.
Within the Communication sector (below) are two mega-cap stocks, Alphabet (GOOG) and Meta Platforms (META), which have a heavy influence on the cap-weighted S&P 500 index. See the illustration below:
Did We Go Through a Correction, or Just A Pullback?
I wanted to take a moment and explain the difference between a correction and a pullback, as defined by Zack’s investment services and agreed upon by most of Wall Street.
A pullback is defined as a decline between -5% and 9.99%.
A correction is defined by a decline between -10% and 19.99%
As we stated last week, along with reasons why we believed these pull backs and corrections occurred, they are a healthy, painful, and necessary way for the markets to remove some of the extreme price action and froth that often plagues good markets.
Recently, there have been plenty of positive economic indicators along with many, if not most, companies reporting good earnings and beating expectations. These factors have driven the latest market’s recovery, and now the S&P is a mere 2% from its last closing high.
Seasonal Weakness is Around the Corner
We are more than halfway through August and on our way to the negative seasonal month of September. We provide the following historical review of September, taken from our friends at Stock Traders’ Almanac.
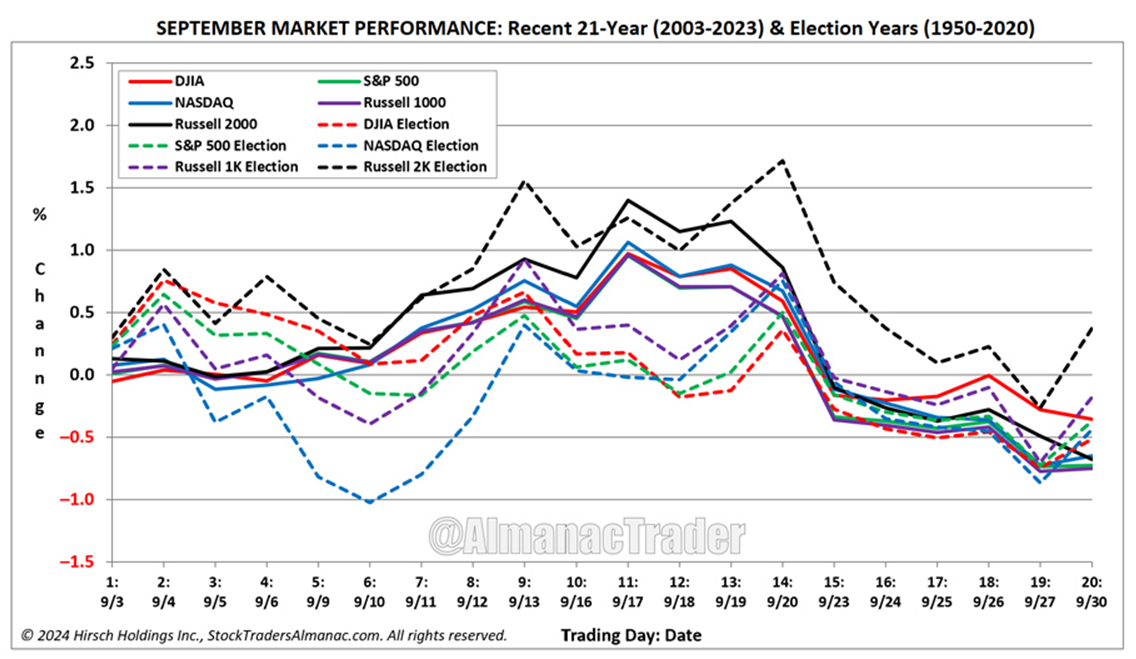
After the summer holiday season, many portfolio managers come back after Labor Day and tend to rebalance and reconstitute their portfolios. Since 1950 September has been the worst performing month of the year for the DJIA, the S&P 500, the NASDAQ and the Russell 2000 (small cap stocks).
September was negative four straight years from 1999-2002. More recently, these four indices have been down seven (7) of the last ten (10) Septembers and the last four years straight. Average losses over the last ten years range from -1.5% by the Dow to -2.9% from the NASDAQ.
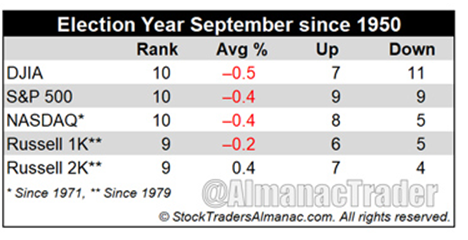
Election years, like 2024, tend to be only slightly better, but the month remains in the bottom third of all months of the typical year. See the following chart for September’s performance for election years going back to 1950:
Here is the chart for September for all years (including election years) going back to more recent times since 2003:
Active Money Managers and Investment Advisors Are Already Preparing for a Potential Negative Seasonal Period
Active managers were a bit freaked out by the recent and sudden downward spike. Since it happened in a relatively short period, they probably overreacted and quickly went into defensive mode (I know several of our investment models did as well).
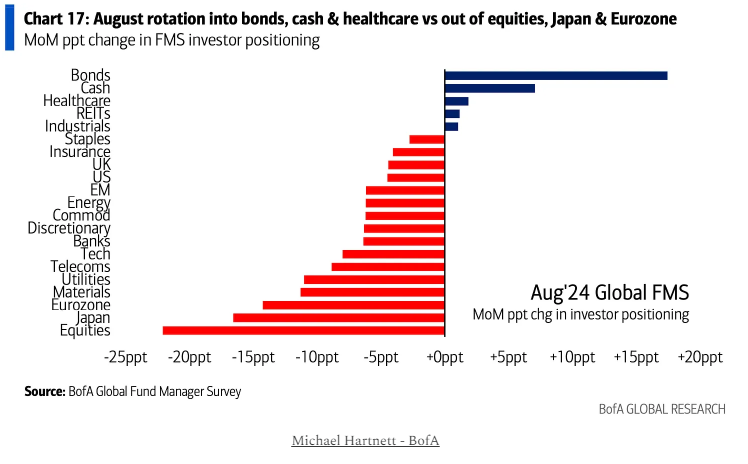
Given the negative September information provided above, it is no surprise to see the latest defensive allocation moves made by active asset managers, as evidenced in the following chart.

Why the Stock Market Could Move Higher Even in the Face of a Negative Seasonal Period
There are several reasons for this, but for brevity’s sake, I will stick with just a few right now.
-
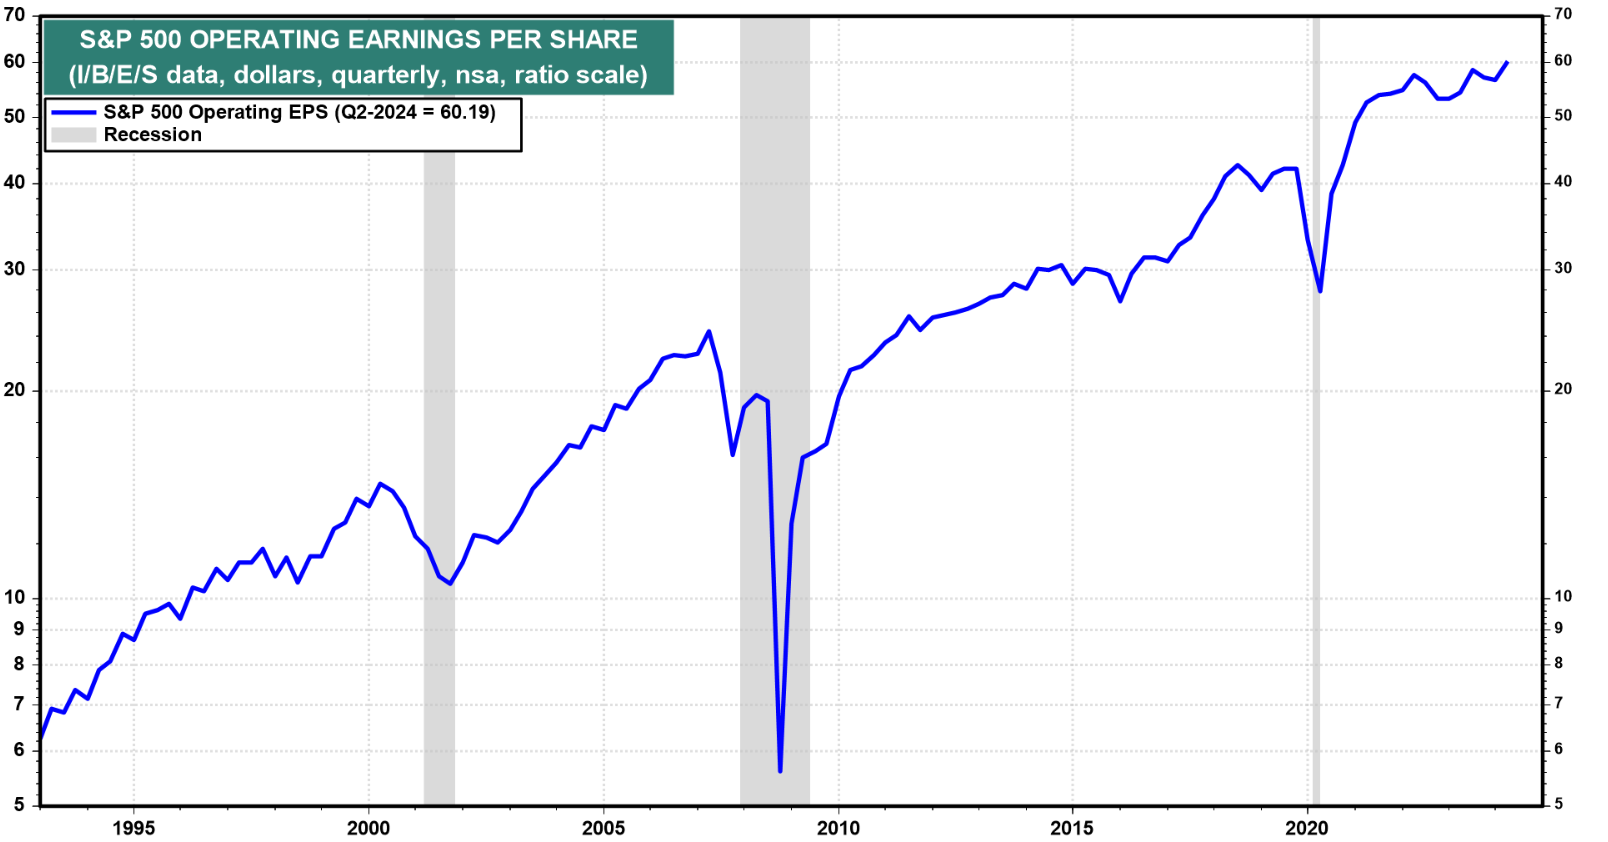
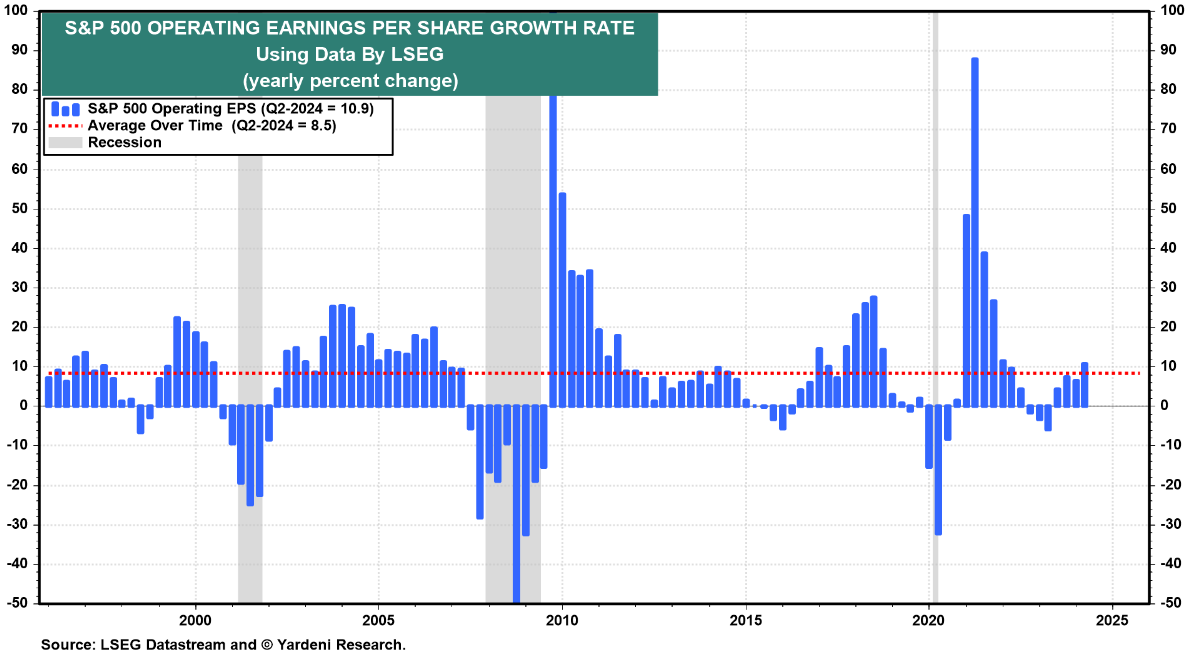
Earnings have been impressive (courtesy of Yardeni Research).
There is absolutely no sign of an imminent recession in the latest earnings reporting season. With more than 90% of the S&P 500 companies having already reported their earnings for Q2, here is the latest scorecard.
S&P 500 operating earnings per share (EPS) rose 10.9% year-over-year during the quarter to a record high of $60.19. This should help keep stock prices elevated, and possibly give them room to advance further. See the following two charts on operating earnings and Growth this past quarter for company earnings.
-
As shown above, active managers have gotten defensive quickly. This is along with hedge funds de-leveraging. If these managers feel that they will be left behind in a new leg up for the markets, they may be forced to put money to work and that would propel stock prices higher.
As you can interpret from the below chart, money managers have moved significant assets into bonds, cash, and healthcare stocks. Again, these are defensive moves. If they determine that it is necessary to put some of the bond or cash holdings back in the market, this would follow our narrative above. See chart below:
-
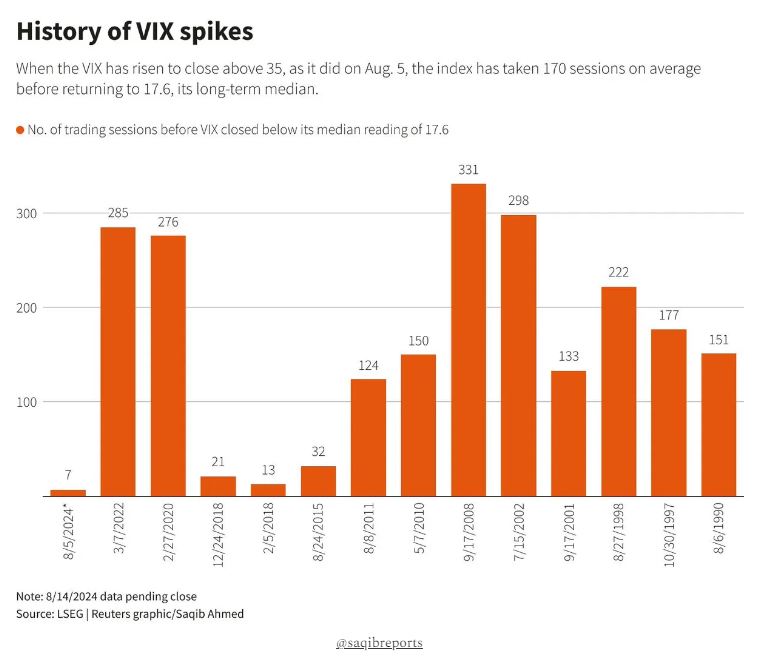
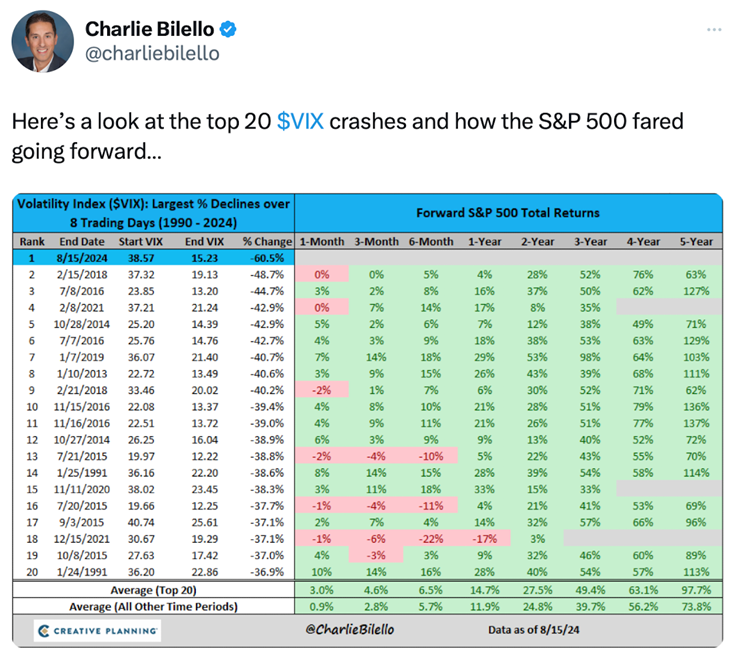
We had a recent VIX spike that was unprecedented. As we point out below, this type of spike in the VIX, which has recently crashed back down to earth, is history in the making. More importantly, the period afterwards has high percents of positive returns one, three, and six months later. See charts below:
The One Asset Class You May Be Missing
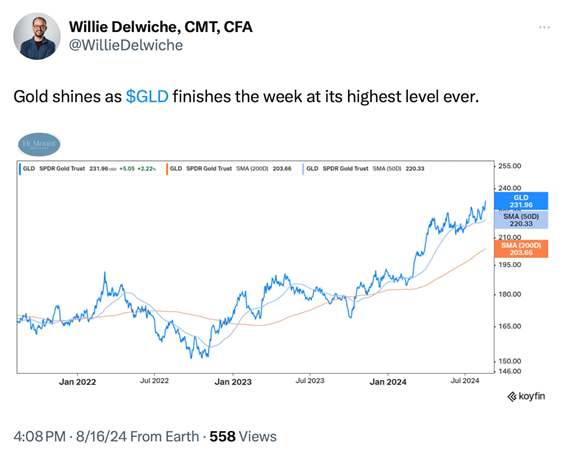
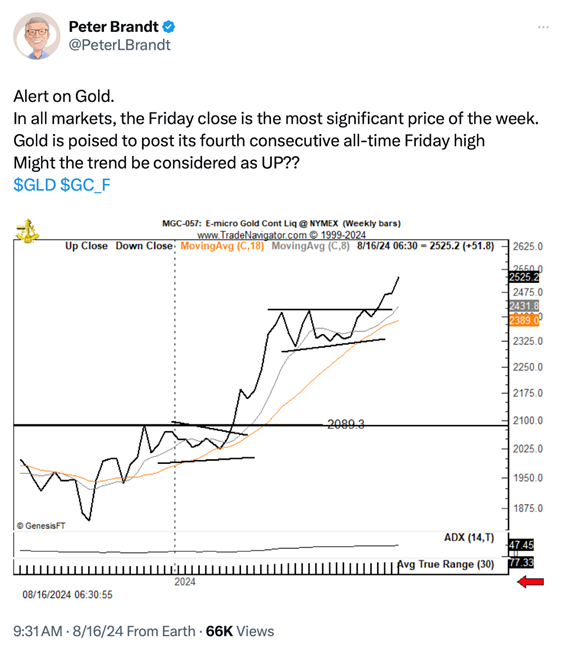
If you are an avid follower of Mish, you are likely aware of what she has been recommending for over a year now. She has gone on numerous TV shows and interviews extolling the need to own commodities with a special emphasis on metals. Specifically, the shiny metal called gold. See chart below:
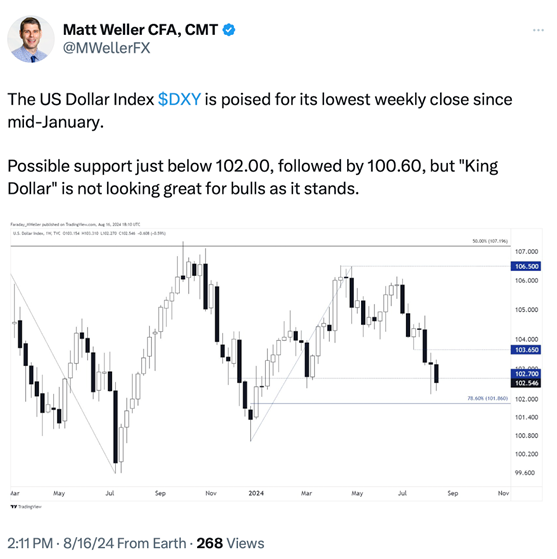
There are a whole host of reasons for gold’s move higher. The least of which is that investors are expecting interest rates to decline, which should weaken the US dollar and help provide physical metals appreciation. For a look at how much the US dollar has declined recently, see the chart below of this week’s move down:
For the near future, the trend for the shiny metal looks good. See chart below:
Additionally, some of our investment models have been invested in gold, silver, and gold miners for some time now. They identified the trend in the metals early on. We hope you have an enjoyable and profitable week ahead. Here are some other factors to note.
Risk On
- All four indexes regained a bullish phase. Despite the monster rally, they are not overbought.
- Emerging and developed markets followed in the footsteps of US markets, closing in bullish phases.
- With the strong rally in stocks over the last 10 days, value is no longer leading growth on both a short- and longer-term basis. Growth is leading over value and the broader S&P 500.
- For both the Nasdaq and S&P 500, the McClellan Oscillator is confirming upward price action and is now positive.
- All sectors were up on the week, led by Technology (XLK) with almost a 10% move in Semiconductors (SMH). Consumer discretionary (XLY) was up over 5%, while Consumer Staples was only up 1.5%.
- Volume patterns improved significantly, confirming price action for the first time in weeks, with the Dow putting in the strongest readings.
- After the enormous spike up, volatility collapsed back to mid-July levels.
- The number of stocks above key moving averages improved significantly, though they reached overbought levels, and we may see some mean reversion. Longer-term, readings are definitely improving.
Neutral
- Gold had a monster breakout above a compression range, hitting new all-time highs and continuing to outperform the S&P 500.
- Risk gauges improved significantly from risk-off to neutral this week, with one of the strongest rallies in the S&P 500.
- Gold miners were a market hotspot, driven by new all-time highs in gold.
- After a big drop in the dollar from the yen-carry trade reversal, which caused a flash crash in the market, it now seems to be under control, with the dollar gaining significant strength against the yen.
- The TLT ETF didn’t move significantly on the week, though it remains at elevated levels in a bullish trend.
- Stocks making new highs or new lows improved this week, though they remain off the levels they have been at for most of this year.
More By This Author:
After An Ugly Start To The Week, The Market Recovers - And Now The Door Is Wide OpenThe Economy Shows Signs Of Slowing And Hits Stocks Hard. But It May Not Be Time To Sell Your Stocks (Yet)
The Rotation Continues & One Sector Has Helped Fuel This Rotation

Comments
Log in or sign up to join the conversation.