

It has been a volatile and exciting week in both the markets and at the Olympics. I recall the old ABC Wide World of Sports adage, “Spanning the globe, and bringing you the thrill of victory and agony of defeat.” That kind of sums up the past 10 days in sports and the markets.
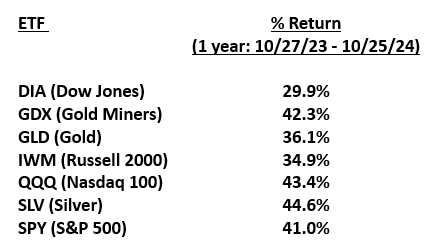
Depending on the different market segments, the Dow, S&P 500, and Nasdaq are all down from their yearly highs, but well off the pounding they took last Monday. See below:

This may not seem like much, but the speed at which these market segments declined, especially the Nasdaq, was swift and shocked most investors, including the big hedge funds that got caught heavy on margin.
Some technology stocks, like Nvidia and other chip manufacturers, fell by as much as 30% within one to two weeks. The technology ETF XLK was down 7% on Monday. See the below chart:

Fear, as measured by the VIX, spiked this past week and priced portfolio insurance (puts) as if we were in a bear market. See chart below:

Perhaps the most surprising part of this recent sell-off was the velocity of the rebound that these stocks had. At the end of Friday, the S&P, which was down 3% on Monday, fully recovered and was unchanged for the week. See below:

This week offered investors the worst and best days they have seen in quite some time. See chart below:

Investor Euphoria
I have lived through several extreme bullish and extreme bearish periods. I believe I have witnessed enough different types of markets to realize that when we are in the midst of a “bull market,” it seems as if stocks will just keep going up and up (and never stop).
Investors get transfixed on waking up every day to see a new high or their favorite stock going up another 1-3%, similar to what we have been witnessing in the semiconductor sector with stocks like Nvdia.
Likewise, I have also experienced a few dramatic market sell-offs/crashes (1987) and extended bear markets, enough to know that during these periods investors believe that stocks will never go up again.
There are folks who monitor these moves and try to forecast what might come next. Here is a chart that was published recently showing that “investor euphoria” was at highs not seen since the tech melt up of 1998-1999. I remind you of what happened next from 2000-2002.
Recently, the 'Euphoriameter' was at the same place it was at in 2000, right before the tech meltdown. See graph below:

The effect of this recent volatility and sell-off is that, for now, the bulls have vanished. As you will see from the chart below, The Investors Intelligence Survey saw the largest two-week drop in bullish sentiment since the 1987 crash. Bulls dropped from 64.2% to 46.9%.

As a bull market matures, investors often become overconfident and complacent. Then investors lack conviction and are questioning the new highs that persist, over and over. This is exactly why corrections are healthy and need to take place. They shake out the weak hands and reset sentiment to more sustainable levels.
What Caused the Sell-Off?
As mentioned above, there was already nervousness in the market and investors were becoming suspect if the markets could continue to climb higher and make new highs. As we also wrote about last week, there has been a rotation going on, with shifts from large-cap tech names to more value-oriented stocks that have higher dividend payouts. Money had also been flowing heavily into small-cap stocks that had been in hibernation for some time.
There have been other reasons that investors have been using since mid-July to sell down Tech stocks which then expanded out into the rest of the market these past 10 days. These reasons include:
- Lofty valuations on many highflyers. The large technology stocks began selling at nosebleed price-to-earnings ratios, and investors realized the “market” was getting expensive.
- We are in the middle of earnings season, and some of the commentary coming out of companies is for a softening in their projections going forward.
- While more than 75% of companies have exceeded their earnings expectations, many of them are not beating their top line revenue projections.
- Earnings disappointments have recently picked up speed.
- Interest rates in Japan had trended up for the first time in over 20 years. This began to affect the Japanese yen to US dollar ratio. Highly leveraged hedge funds and institutional parties use the Japanese yen currency as part of their margin programs. Hence, they began unwinding their “margin-carry” trade 10 days ago. This took down some highly liquid and profitable positions these funds held as part of this trade. Names like Nvidia, Broadcom and other stocks (and chip stocks) that have doubled in less than a year were used to raise cash and reduce margins.
- A slowdown in the economy. As we illustrated in last week’s column about the ISM and jobs numbers, disappointing numbers in these areas spooked the markets as a soft landing became questionable. This was also reflected in the interest rate markets, as rates on the 10-year plunged to below 4.0%
Institutional Risk Appetite has Also Been Declining
Portfolio managers have been adding risk most of this year, but got a bit too bullish in mid-July, just as they had in July 2023. Both Julys (2023 and 2024) ended up being near-term highs for the S&P 500. See chart below:

All told, instead of an orderly pullback, the market selloff picked up speed and momentum. Within a few days, the market saw bigger volume coming in and more selling taking place. Last Monday, the markets had a 3% (or more) decline in the Nasdaq and a 1,000-point pullback in the Dow.
Other than small-cap stocks (IWM) which went negative on the year this past week, the other markets have respectable gains for the year (S&P 500 up 12%), and many investors were motivated this past week to lock in gains and reduce risk.
Are We Facing a Hard Landing Now or Even a Recession?
After the jobs report last Friday, this was the question permeating around Wall Street. Many analysts believed that if the market correction got too severe, the Federal Reserve might step in and lower rates in an emergency action this past week. We did not buy into this rhetoric and suggested to our clients that this was just a long overdue pullback in technology stocks and other high-flyers.
However, there are additional signs that there could be trouble ahead.
Over the past week, we heard from several large employers that they would be laying off employees. Cisco Systems reportedly plans to fire thousands more of its people in a second round of mass terminations this year. In February, the company dismissed about 4,000 employees.
Another big employer, Intel, announced plans to fire 15,000 people as it contends with sluggish sales of its semiconductor chips. Dell is also terminating employees as part of a reorganization of its sales team.
It is likely that the job market could slow to a trickle and that unemployment, which has notched up the past few months, may head higher. That flashed the “recession” indicator. More on that in a minute. Some other signs that the economy is weakening are shown below:
Credit Card Debt

The Housing Industry is Struggling
A combination of high mortgage rates, a shortage of supply, and now a lack of purchasing power due to inflation have hit the housing industry hard.
Just this week, new indicators show that the industry is being hit with a significant downward adjustment of listing prices, which is a sign that the economy may be headed for a harder landing than originally thought. See chart below:
Price Drops

This past week, Jamie Dimon, the CEO of JP Morgan Bank, was interviewed by CNBC. They asked him if we may be entering a recession.
His response was “not at all.” He went on to say “I think people overreact a little bit to the daily fluctuation of the market. And sometimes it’s for good reasons. Sometimes it’s virtually for no reason.”
But Dimon made it clear he believes the odds of a recession outweigh those of a soft landing now. He also cited uncertainties on topics ranging from geopolitics and the US deficit to quantitative tightening, housing, and elections.
However, the key economic analysts at JP Morgan did raise the expectations for a future recession on Wednesday. JP Morgan economists now see 35% odds of a US recession before the end of the year, a 10% rise from early July expectations.
Last Tuesday, David Solomon, CEO of Goldman Sachs painted a more optimistic picture. “My view is that the best chance, as we look forward, is the economy will chug along and we probably won’t see a recession,” Solomon said in a Bloomberg interview. Last Sunday, Goldman’s economist raised the firm’s expectations of a US recession coming in the next 12 months to 25% from 15%
A Possible Hard Landing for the Stock Market
According to Michael Hartnett, market strategist from Bank of America, investors can expect a hard landing in the economy if the S&P 500 drops below a key technical level. Hartnett highlighted the S&P 500’s 200-day moving average as a key line in the sand that would signal whether the economy is heading for a bigger downturn.
According to Harnett, “technical levels that would flip Wall Street narrative from soft to hard landing have not yet been broken... 4% on 30-year Treasury, 400 basis point spread on High Yield credit spreads and 5050 on the S&P 500.”
He has been suggesting to their clients to reduce risk and possibly sell high beta stocks at the first Fed rate cut. He points out that the first cut typically signals the end of an inverted yield curve, and that a flatter yield curve points to a possible recession and a negative environment for risk on assets, including stocks and high yield bonds.
The Door is Wide Open for The Fed to Reduce Rates in September
Given the softness we are seeing in the economy right now, coupled with increasing job layoffs and reduced hiring, the door is wide open for the Federal Reserve to begin cutting rates. This is something we have been writing about over the past month The odds of the Fed making a rate cut at their upcoming September Federal Reserve Open Market Committee meetings in September stand at greater than 90%.among forecasters.
However, because of recent market weakness and higher softness in the labor market, the expected interest rate cuts in September are projected to be 50 basis points, not the 25 basis points that most analysts expected before these past few weeks and worsening economic signs.
Why We Remain Optimistic and Positive
Having spent much of my professional career working for a NY firm that did extensive research on the earnings of companies, I remain of the opinion that most of the time company’s earnings are the main drivers of stock prices, long-term.
That said, we are currently in an earning growth period (8% annual expected growth of earnings for 2024) that should translate into keeping stock prices buoyant. Long bear markets typically are highly correlated to stagnant or contracting corporate earnings. That is not where we are today.
As we have mentioned often throughout 2024, earnings are, for the most part, beating expectations and many companies are surprising to the upside. See the chart below highlighting this period of growing earnings. This is positive for the stock markets. It also may have helped with the quick recovery we saw in the markets over the last two weeks.
Price vs. EPS

This last chart below shows a recent anomaly that occurred last week, which should translate into higher stock prices going forward.

We hope that this outlook today may have helped you gain additional insight into the recent market volatility. As always, we are grateful for your time and attention.
We also want to wish you a safe and enjoyable remainder of the summer. We experienced very inclement weather in our area last week, and hundreds of thousands of residents had to go without power. Some are still without it and/or living outside their homes. So, stay alert and seek shelter if you are posed with a threatening weather situation.
Have a profitable week ahead. Be careful out there.
Risk On
- Foreign equities actually are now out performing US equities on a short-term basis, with Emerging Markets (EEM) leading more established markets (EFA), and with both closing positive on the week.
- The percentage of stocks above key Moving Averages hit oversold levels and are now bouncing, which is positive on a short-term basis.
- The Dow Jones Industrial Average (DIA) closed in a bull phase, despite the selloff that started mid-July.
- The weekly charts for the four indices all closed beneath their 10-week averages, but they are holding on to their bull phases and their 50-week moving averages.
- The three-month verses the one-month volatility ratio, an important sentiment reading, improved by Friday's close and crossed above the 10-day moving average.
Risk Off
- The 52-week new high/new low ratio broke down hard last week, and it continued to deteriorate for both the S&P and the Nasdaq.
- Gold remained in a bull phase this week, not far from all-time highs, with the weekly charts looking even more impressive -- assuming we can hold onto the 10-week moving average as a flight to safety continues.
- The charts show indices flipping negative across all time frames, while the Nasdaq 100 remains negative. And, interestingly, a bit of a mixed but mostly negative read in the S&P can be seen.
- Risk gauge remains in full risk-off mode.
- Volume patterns are negative for 3 out of the 4 key indices.
- Value stocks (VTV) are still holding up in a bull phase, while growth stocks (VUG) are languishing in a warning phase. Value stocks are now outperforming growth on a longer- and shorter-term basis.
Neutral
- After a nasty -3 to -4 % drop across all four key US equity benchmarks on Monday, they all recovered their losses by Friday's close. However, except for the Dow, they all closed in warning phases.
- Soft commodities (DBA) also closed positive on the week, and is outperforming the S&P 500.
- Volatility exploded to the upside on Monday, and it fully retraced to the breakout point. It remains to be seen if this is just a historic flush in the markets, or the beginning of a larger leg down.
- Oil (USO) regained a warning phase this week. This is not surprising considering the rising tensions in the Middle East and a mixed economic picture.
- 8 of the 14 sectors were down on the week, with Utilities (XLU) dropping -.9%, while Semiconductors (SMH) actually closed up +2.9%. Also, the Consumer Discretionary sector gave a very mixed read.
- Interest rates got overbought and mean-reverted, but are still holding above key break out levels. The yield curve inversion, depending on the time frame, either remains intact or has normalized.
More By This Author:
The Economy Shows Signs Of Slowing And Hits Stocks Hard. But It May Not Be Time To Sell Your Stocks (Yet)The Rotation Continues & One Sector Has Helped Fuel This Rotation
The Beginning Of A Stock Market Summer Storm? Or Just A Passing Shower?

Comments
Log in or sign up to join the conversation.