

Image Source: Pexels
Market Brief – Powell’s “Fairly Highly Valued” Echo of Greenspan
Jerome Powell’s statement this past week, that U.S. stocks appear “fairly highly valued,” wasn’t as dramatic as Alan Greenspan’s 1996 “irrational exuberance” speech, but the market heard the echo. Both comments speak to a central tension in monetary policy: the Fed may not explicitly target asset prices, but valuations matter when they begin to feed back into financial stability. Investors often dismiss these warnings, citing years of Fed liquidity support and low interest rates. Greenspan’s caution came four years before the dot-com bubble burst. Powell’s remark comes when AI and momentum stocks dominate the indexes and speculative fervor shows itself in narrower leadership, IPO enthusiasm, and leverage in options markets.
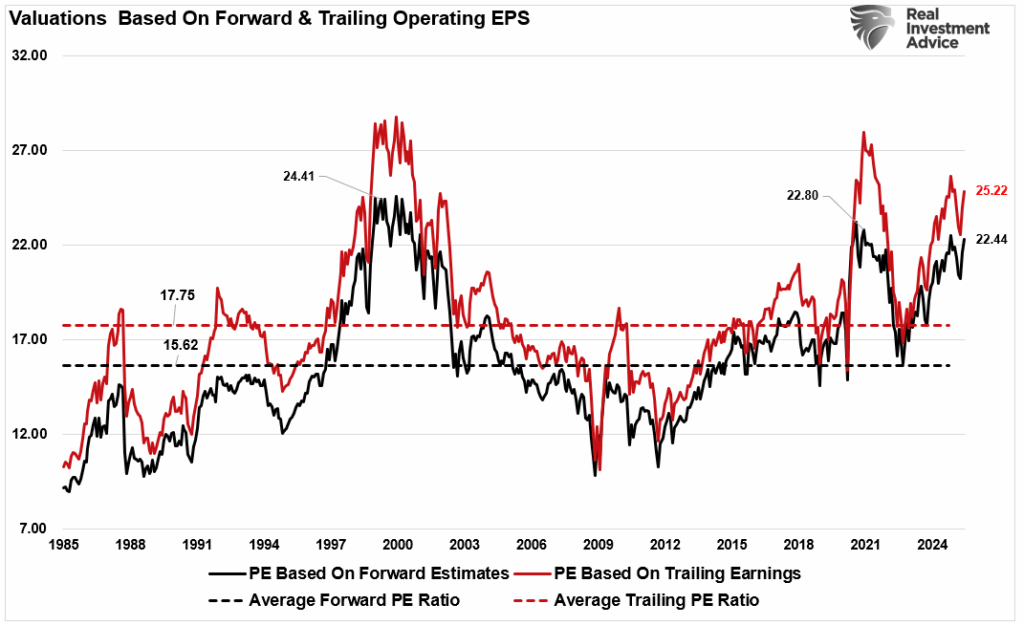
As noted in the “Bull vs Bear Case,” high valuations remain a concern. Forward P/E for the S&P 500 sits at 22.5x earnings with trailing earnings at 25x. UBS notes that such readings are among the top 5% since 1985.
(Click on image to enlarge)
The timing also mattered. Powell’s comment landed after five straight months of equity gains and one of the longest stretches in history without a single 2% daily move in the S&P 500.
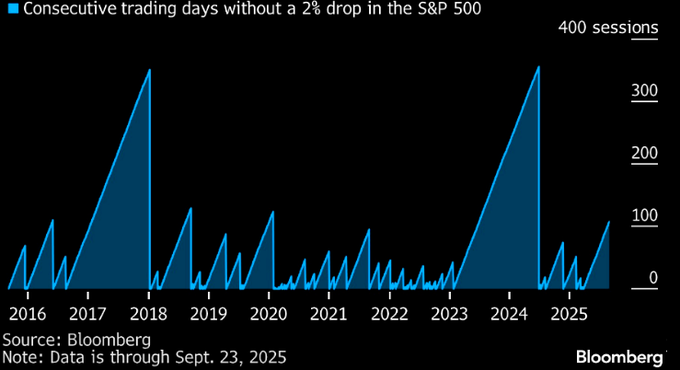
That calm, combined with deeply oversold bond volatility, created an environment of complacency where traders assumed the Fed would remain supportive no matter what. In that context, Powell’s words felt like a bucket of cold water. The Nasdaq quickly retreated from its highs, Nvidia gave back early-week gains, and Amazon broke below short-term support. Money flows began to weaken, showing investors quietly taking risk off the table.
But we shouldn’t miss the larger point. Powell’s “fairly highly valued” remark wasn’t about sparking panic but signaling that the Fed sees valuation risk building again. It reflects a subtle shift in the Fed’s communication strategy, where inflation moderates, but financial asset pricing has stretched relative to underlying growth. The Fed knows that inflated valuations make markets more fragile if growth disappoints or credit conditions tighten. Investors ignoring this are repeating the same complacency seen in the late 1990s.
Another layer to this is quarter-end rebalancing. As we approach the close of September, large institutional investors, pensions, endowments, and insurance companies must rebalance portfolios. After five months of equity outperformance, those flows will likely mean trimming equity weightings and redeploying into lagging sectors like bonds or international markets. In practical terms, that creates selling pressure in the sectors that have become most extended, namely mega-cap technology. This dynamic doesn’t mean the bull market is over, but it often produces short-term pullbacks that catch momentum traders off guard.
This mix of Fed caution, stretched sentiment, and mechanical portfolio rebalancing argues for more volatility in the days ahead. As always, investors should separate the short-term flows from the longer-term narrative. Greenspan’s “irrational exuberance” did not stop the bull market in its tracks; it accelerated afterward. Powell’s words may be similar, and something investors ignore until it is too late. However, they serve as a reminder that valuations are a poor timing tool but an excellent measure of future risk.
OUTLOOK: Neutral / Cautious – Powell’s statement won’t end the rally on its own, but it highlights the fragility of today’s market structure.
Technical Backdrop
Technically, markets remain extended relative to long-term averages, though early cracks show. As noted, money flows have shown some weakness, and with the S&P 500 closing Friday at ~6644, modestly below its recent peak, but still comfortably above its 50-day moving average at ~6460 and its 200-day moving average at ~6014. The trend remains intact, but the distance above moving averages suggests limited upside without consolidation. For perspective, a retracement to the 200-DMA would entail a 10% decline. However, a retracement to the running bull trend line near the April lows would encompass a 24% decline, and we would still be in a bull market.
(Click on image to enlarge)

Furthermore, breadth remains weak, with only about 49% of S&P components above their 20-day average and only 56% above their 50-day average. With markets consistently hitting new highs, the breadth should be much stronger. Negative divergences continue in momentum and relative strength oscillators (RSI, MACD), hinting at waning upside pressure.
(Click on image to enlarge)
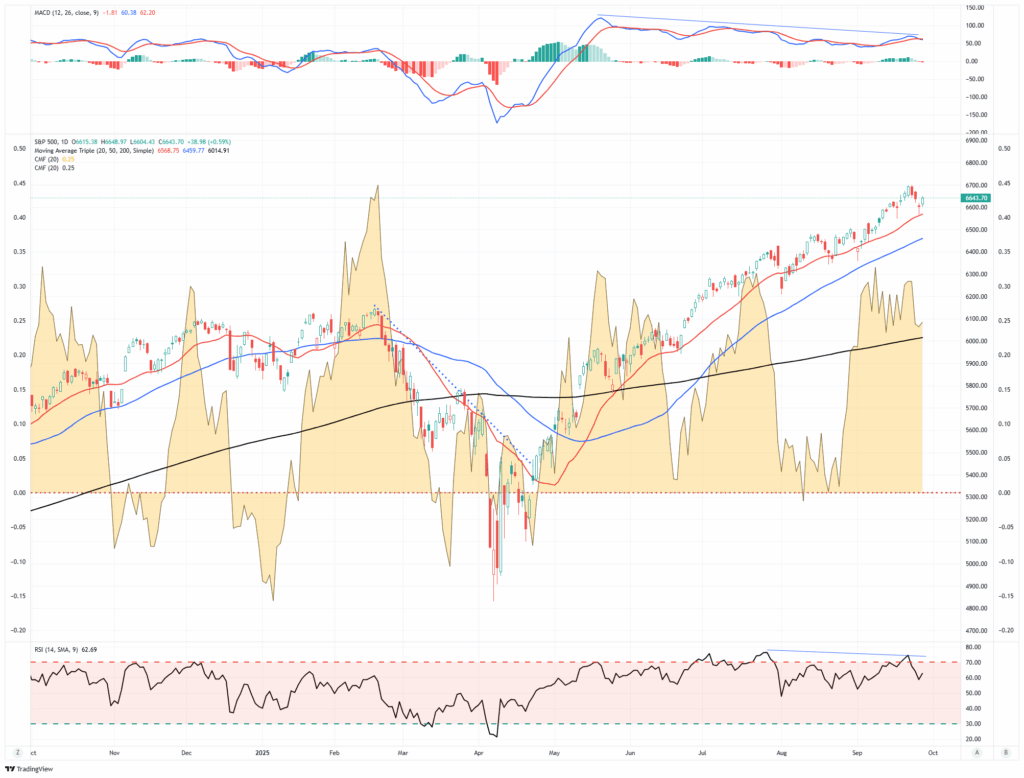
Equal-weighted indexes lag cap-weighted peers, further underscoring the leadership concentration. Lastly, as measured by the VIX, volatility ticked up toward 15.29, which is still low historically but suggests that hedging demand is picking up.
Support and Resistance Levels:
- Support: 20-DMA ~6568; 50-DMA ~6459; 200-DMA ~6014.
- Resistance: Prior highs near 6666-6700.
- Volatility: VIX remains subdued but rising off the floor.
OUTLOOK: Neutral / Slightly Bearish – The uptrend is intact, but divergences and stretched conditions argue for caution. Quarter-end flows may push markets toward support zones before setting up a potential rebound into October.
Key Catalysts Next Week
The final week of September is busy with catalysts beyond rebalancing flows. Economic data will update the picture on consumers, housing, and employment. All of these matter for Powell’s balancing act between valuations and growth.
(Click on image to enlarge)

OUTLOOK: Elevated Volatility Risk. With Powell’s valuation comments still echoing and quarter-end rebalancing underway, even modest surprises in data could trigger sharper swings. Watch payrolls and consumer confidence for directional cues.
Need Help With Your Investing Strategy?
Are you looking for complete financial, insurance, and estate planning? Need a risk-managed portfolio management strategy to grow and protect your savings? Whatever your needs are, we are here to help.
Markets Detached From Economic Fundamentals
For much of 2025, the market has seemingly lost touch with the economic reality surrounding it. The S&P 500 continues to press new heights, driven primarily by a narrow group of mega-cap technology stocks tied to the artificial intelligence theme. Yet, the picture is far less rosy when we look at the economy.
Yes, Gross Domestic Product (GDP) for Q2 rose at a 3.8% annualized pace, following a −0.5% contraction in Q1. At first glance, that looks encouraging, but the details show the rebound was less the result of robust growth and more the product of weaker imports and temporary consumer strength. Business investment remains sluggish, exports are under pressure, and inventories are being run down. None of those points leads to sustainable economic momentum.
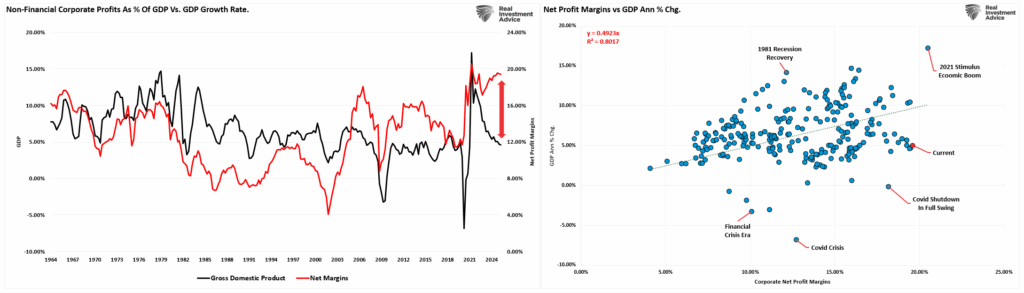
Corporate profits are also beginning to crack. After a brief rebound in late 2024, profits fell by 3.3% in Q1 2025, suggesting that cost pressures, tariffs, and slower demand are weighing on margins. While profits as a share of national income remain historically high, that strength is not broad-based and may be overstated by accounting adjustments. In short, the earnings picture is not consistent with the multiples the markets are paying. Furthermore, the current detachment of corporate net profit margins from economic growth is unusual, given the historic correlation (80%) between the two.
(Click on image to enlarge)
Valuations are stretched to extremes. The Buffett Indicator, the ratio of total market cap to GDP, sits above 217%, exceeding even the dot-com bubble’s peak near 150%.
(Click on image to enlarge)

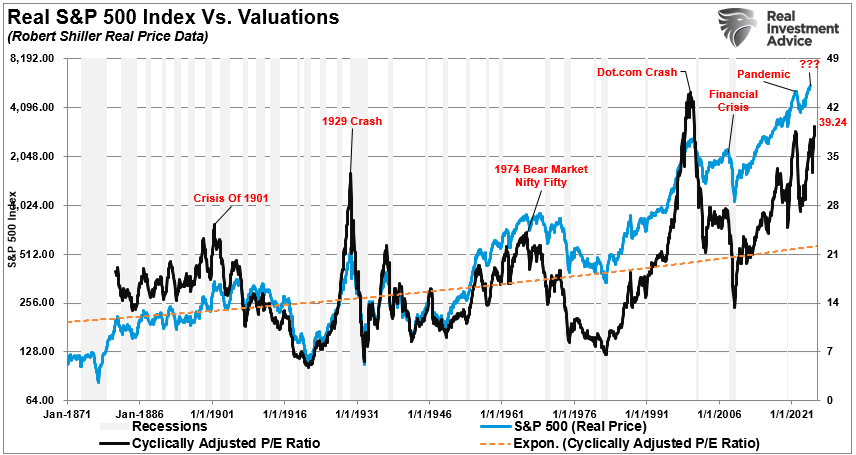
Forward P/Es on the S&P 500 remain north of 22x, well above the long-term average of about 16x, and the Cyclically Adjusted P/E Ratio (CAPE) is near 40x earnings.
(Click on image to enlarge)
The forward earnings yield of 3.9% is below the 10-year Treasury yield of 4.4%, meaning investors are being paid less to take on more risk. Historically, that compression of the equity risk premium has preceded periods of weak equity returns. On Monday, we made such a point in the “Bull vs. Bear Case.“
“The prospective equity risk premium (based on expected returns) is negative, and the ERP indicator from the Shiller data continues to track around 20-year lows. All the warning signs are there, and we need to be paying closer attention to opportunities in bonds and risks in stocks, with the next logical step for asset allocators being a switch to underweight stocks and overweight bonds.“ – Thomas Callum
(Click on image to enlarge)

Meanwhile, the yield curve remains flat to inverted, with the Cleveland Fed’s model putting recession odds at 25–30% over the next year. History tells us that every recession since the 1960s has followed similar curve dynamics. However, this “time is different,” given the ongoing knock-off effects of the massive liquidity injections following the pandemic, which keep the markets detached from economic growth. How long that will continue is up for debate.
(Click on image to enlarge)

The critical point is that investors ignore the signals, which doesn’t make them less real. In short, the market has priced in perfection, and its detachment from the underlying economy tells a story of fragility. Historically, that detachment rarely ends well.
The Forces Keeping the Market Elevated
Even though the market is detached from weak fundamentals, investors can remarkably ignore bad news. However, several forces explain why the market is detached, which should give investors some pause.
The first force is monetary policy, or more accurately, expectations of monetary policy. Even after aggressive rate hikes, the markets never ceased pricing in the belief that the Federal Reserve would, and now will, cut rates. The recent moderation in inflation data, particularly core readings, fueled the perception that the Fed can ease without reigniting price pressures. Furthermore, bullish investors are emboldened by “sticky inflation” as it is a sign the economy is still growing, supporting forward earnings expectations. Inflation falling too quickly would suggest a potential recession and slowing earnings, bringing valuations into focus.
(Click on image to enlarge)

Crucially, for investors, lower expected rates reduce discount rates, which investors use to justify paying higher multiples for equities.
Second, the narrative power of technology cannot be overstated. Artificial intelligence, cloud computing, and data infrastructure have created a gravity well for capital flows. Investors will pay extraordinary valuations for any company associated with these themes, regardless of near-term profitability. As with past bubbles, from railroads in the 1800s to the internet in the 1990s, narratives can cause markets to detach from fundamentals far longer than logic would suggest. But that is the current force of momentum trade in the markets.

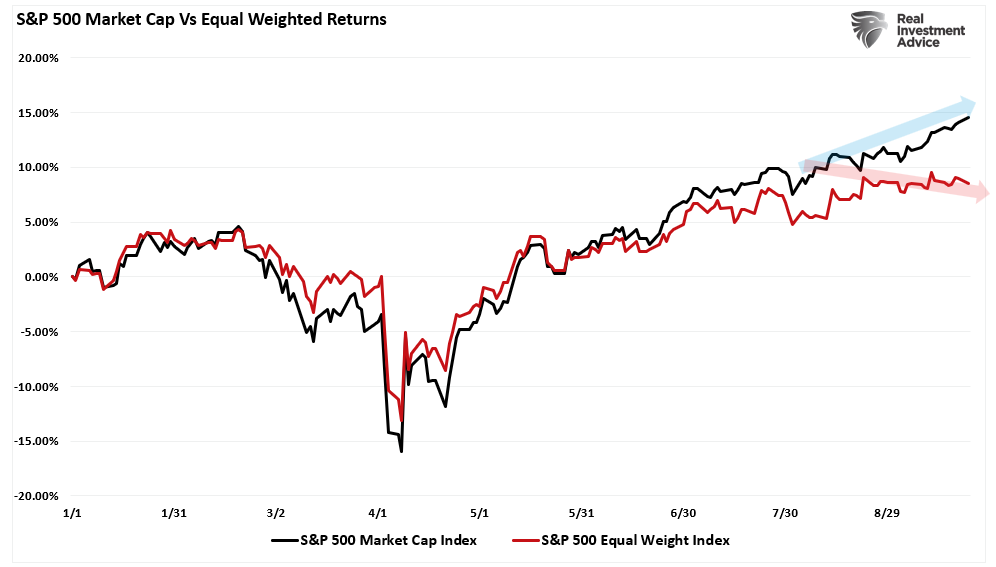
Third, liquidity and passive flows are decisive in keeping the markets detached. Trillions of dollars are tied up in index funds, which allocate capital based on market capitalization. The top ten stocks outperform, attracting more flows and increasing prices. This self-reinforcing loop makes markets appear firmer than they really are, but in reality, the breadth has been weak, meaning most stocks aren’t participating in the rally, but the indices still surge because of outsized gains in a few names. We recently made a point of looking at the performance difference between the market-cap and equal-weighted indices.
(Click on image to enlarge)
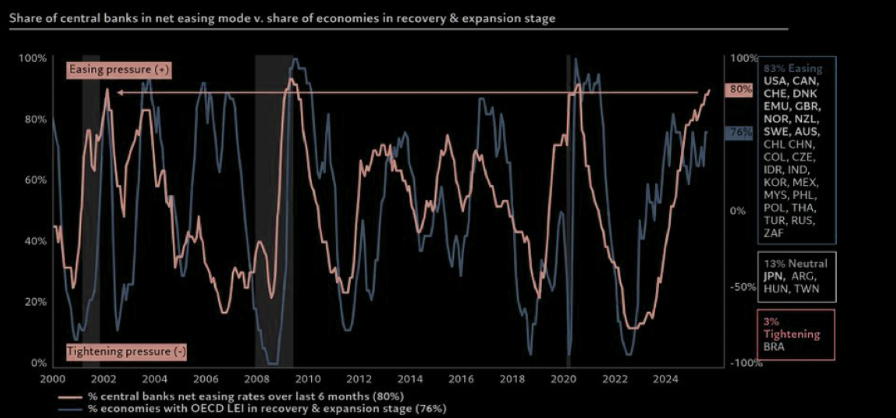
Finally, global capital views the U.S. as the “least dirty shirt.” With geopolitical risks abroad, weaker growth in Europe and China, and volatility in emerging markets, foreign investors see U.S. equities as the most liquid and safest option, even at elevated valuations. This demand provides ongoing support even as fundamentals deteriorate. Furthermore, global central bank support is increasing with rate cuts:
“Eighty percent of global central banks have eased rates in the past six months, and 76% of OECD economies’ leading indicators are now in expansion or recovery. Liquidity is abundant, growth momentum is improving, and investors are being pushed further out the risk curve”.- Goldman Sachs
(Click on image to enlarge)
Together, these forces create a market environment where perception trumps reality. Investors are betting the Fed has their back, technology will change everything, and liquidity will remain plentiful.
But history reminds us that narratives eventually give way to fundamentals.
The Risks Investors Should Watch
When markets detach from fundamentals, the risks are magnified. However, this is when investor sentiment becomes more bullish, and those risks are dismissed. This is also when investors should be especially attuned to potential catalysts that could shatter the illusion of stability. More importantly, the market’s technical composite also registers some of its highest readings, reflecting investor sentiment and market momentum chase. Elevated readings historically always precede corrective market actions.
(Click on image to enlarge)

Furthermore, the most immediate risk is earnings. With valuations already stretched, companies have little room to miss expectations. If profit margins weaken under the weight of higher wages, tariffs, or slower demand, the market’s lofty multiples will quickly look unsustainable. Early guidance cuts by several large-cap names suggest that Wall Street’s optimism may be misplaced. This was a warning in Monday’s blog post:
“High valuations mean expectations are high and reflect investor sentiment. However, if earnings disappoint, then forward valuations (expectations) must be recalculated, and currently, the margin for error is slim at best. Notably, given that earnings are derived from actual economic activity, the current gap between the annual change in earnings and GDP is notable. The long historical correlation between the two suggests that a higher degree of risk to investors may be present more than realized.” – Bull vs Bear
(Click on image to enlarge)

While “sticky inflation” indicates economic activity, it can also pose another risk. While headline inflation has eased, core services, particularly shelter costs, remain sticky. If inflation proves more resilient than expected, the Fed may be forced to reduce rate cut expectations. Such a scenario would undermine the discount-rate assumptions that have fueled the current rally.
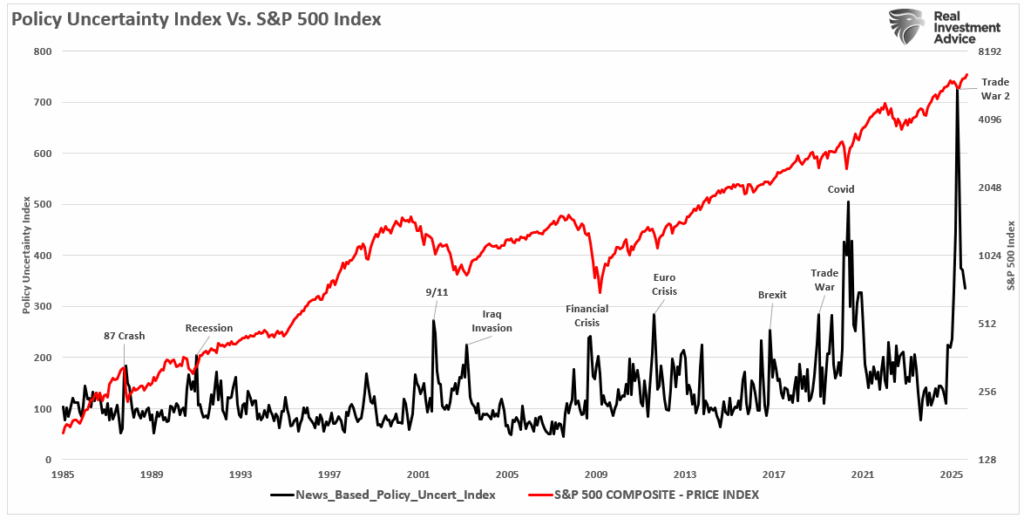
Policy and geopolitical risk should not be ignored. The OECD has warned that the full impact of U.S. tariffs on imports has yet to be felt. Profit margins could take a hit as those costs ripple through supply chains. Add in ongoing geopolitical flashpoints, from trade disputes with China to energy market volatility, and the stage is set for potential shocks that the market is not pricing in.
(Click on image to enlarge)
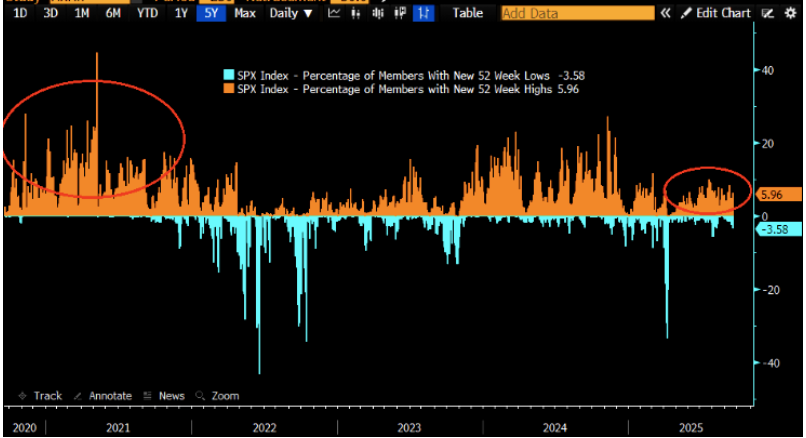
Sentiment itself is fragile. If investors believe in the soft-landing narrative, capital will flow into equities. But once sentiment shifts, the downside can be violent. It is not uncommon for markets to detach from fundamentals, as the “fear of missing out” rises; however, it also works in reverse when investors begin to develop the “fear of being caught holding the bag.” Given weak breadth and heavy concentration in a few mega-cap names, any reversal in those stocks could spark broader selling. As noted by Goldman Sachs:
“10 S&P stocks are responsible for nearly 2/3rds of the index’s gain this year (5 stocks nearly make up 50% of the move). Alternatively, about 40% of S&P stocks are still DOWN on the year … Even though the major indices are hitting new all-time highs, the percent of S&P members making new 1y highs is fairly close to the percent of S&P members making new 1y lows.”
(Click on image to enlarge)
While the markets are detached from fundamentals, the bulls remain in solid control. Retail inflows, corporate share buybacks, and professional managers’ underexposure continue to fuel lifting asset classes. Such is particularly true in Megacap technology names, where professionals seek exposure.
(Click on image to enlarge)

The bulls have compelling arguments about rate cuts, AI tailwinds, and liquidity, but many are already reflected in current prices.
However, the bears have significant threats, including overvaluation, inflation risk, and growth slips, but many only trigger under adverse surprises.
Your task is not to pick who “wins,” but to position so your assets survive (and ideally prosper) whatever comes.
Portfolio Tactics – What Really Matters
For investors, the key is not to predict the precise timing of when a market detached from fundamentals reverses, but to manage portfolios with the understanding that they eventually will. The most dangerous phrase in investing remains: “This time is different.”
This time is not different, and the outcome for inexperienced investors will ultimately be the same. Here are some thoughts about how to navigate “whatever comes.”
- Risk management. With valuations stretched, forward returns are likely to be lower, and volatility higher. That means investors should review their allocations to equities, particularly in passive index funds heavily weighted toward the most overvalued stocks. Trimming exposure at the margin and taking profits where appropriate is not market timing, it’s discipline.
- Diversify beyond the narrow group of mega-cap growth names. History shows that leadership changes when cycles turn. Sectors tied to value, dividends, or cash flow generation may underperform during speculative manias, but they provide essential ballast when the narrative unwinds. Quality matters more in environments where margins and growth are under pressure. Don’t forget about bonds.
- Hold cash and short-duration bonds as “dry powder.” Cash is no longer trash in an environment where equity risk premiums are compressed and bond yields are competitive. Holding liquidity reduces portfolio volatility and positions investors to seize opportunities when valuations reset.
- Maintain hedges where possible. Whether through tactical allocations to defensive sectors, gold, or hedging strategies, portfolios should have protection against sudden drawdowns. While these hedges may lag during speculative advances, they often prove their worth when the narrative breaks.
- Resist the temptation to chase. Fear of missing out is powerful, but chasing elevated valuations is the surest way to destroy long-term returns. Markets may continue higher in the short term, but fundamentals will eventually reassert themselves. When the cycle turns, patient, disciplined investors who manage risk today will have the capital and flexibility to buy quality assets at more attractive prices.
In short, portfolio strategy in this environment is less about maximizing returns and more about minimizing avoidable risks. Protecting capital through discipline, diversification, and prudence is the best way to ensure long-term success when markets are detached from reality.
Trade accordingly.
(Click on image to enlarge)

More By This Author:
Slowdown Signals: Are Leading Indicators Flashing Red?
Is Nvidia Recycling Profits?
Pfizer Tries To Fatten Its Profits With Weight Loss Drugs


Comments
Log in or sign up to join the conversation.