
Output, employment and value added:
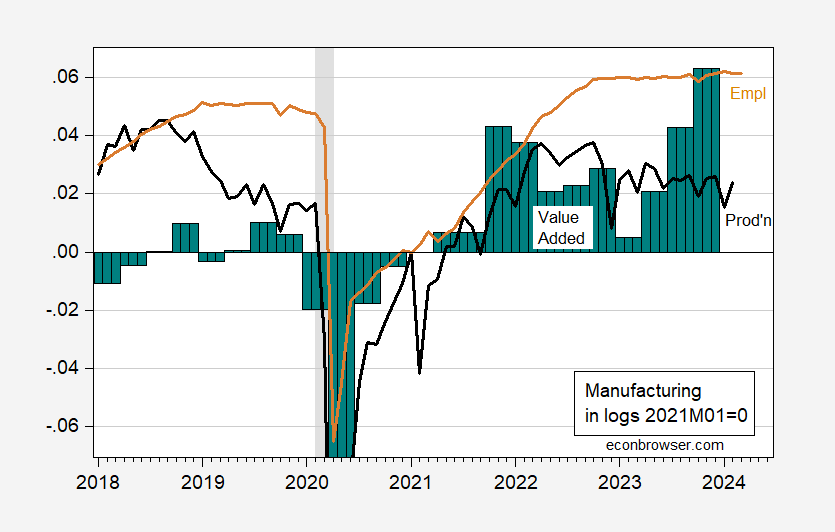
Figure 1: Manufacturing production (black), manufacturing employment (tan), real value added (teal bars), all in logs, 2021M01=0. Source: FRB, BLS, via FRED, BEA, and author’s calculations.
Real value added and employment are about 6% higher than when Biden took office. Manufacturing production (which is a gross measure) is only about 2% higher.
More By This Author:
Thinking About Trade War IIBusiness Cycle Indicators: Employment Along With Coincident Index, VMT, Heavy Trucks, And Sahm Rule
March Employment Indicators for Nonfarm Payroll


Comments
Log in or sign up to join the conversation.