Manufacturing On The Ropes?

Image Source: Pexels
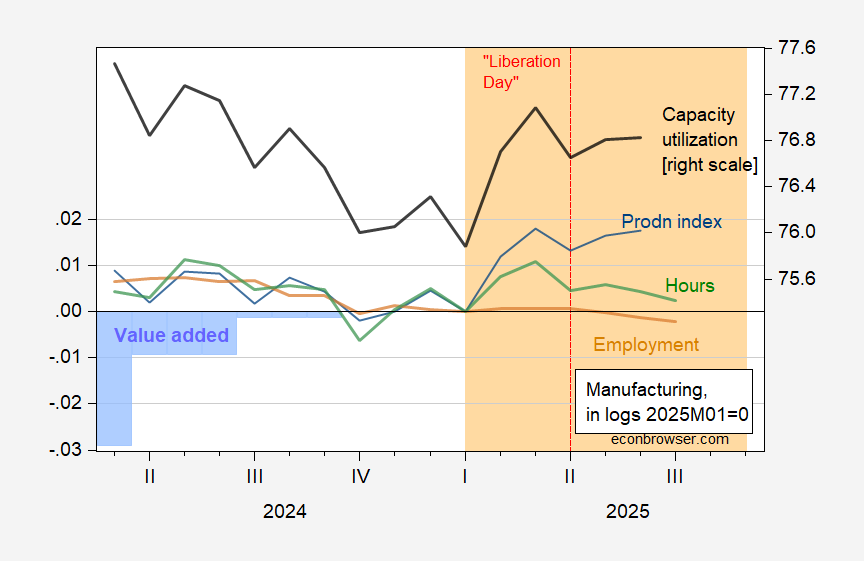
Manufacturing employment, hours, capacity utilization down since March 2025 (pre-“Liberation Day”); manufacturing production (Fed index) flat since March.
(Click on image to enlarge)

Figure 1: Manufacturing employment, all employees (brown), manufacturing aggregate hours (green), manufacturing production (blue), real value added in manufacturing (blue bars), all in logs,2025M01=0; manufacturing capacity utilization (bold black line, right scale). Aggregate hours calculated by multiplying average weekly hours times employment of production and nonsupervisory workers. Source: BLS, Federal Reserve, BEA, and author’s calculations.
Notice that since we are indexing to 2025M01=0, the fact that it’s difficult to see the value added series over the last two quarters means that value added has been essentially flat over that period.
These are all backwards looking indicators. The ISM manufacturing PMI – new orders component doesn’t look too promising. And all this is before the tariffs take full effect, and retaliation (aside from China).
(Click on image to enlarge)

Source: ISM, accessed 8/7/2025.
More By This Author:
CalculatedRisk (Still) On Recession Watch
Even More Depressing Pictures From The Labor Market
EPU And EPU-Trade Policy Uncertainty Measured


