

Image source: Pixabay
I have delayed reviewing this portion of chapter 26 of the Project 2025 because I knew it would be painful to read. But as the election nears, it’s incumbent upon all of us to take up our burdens in support of good policy. So here is some key text from this portion of the chapter, written by my onetime (40-42 years ago) coauthor Peter Navarro (the second portion, “The case for free trade” by Kent Lassman is a useful orthodox treatment of trade policy).
The United States of America is the world’s dominant superpower and remains
the world’s arsenal of democracy. To maintain that global positioning—and thereby
best protect the homeland and our own democratic institutions—it is critical that
the United States strengthen its manufacturing and defense industrial base at the
same time that it increases the reliability and resilience of its globally dispersed
supply chains. That will necessarily require the onshoring of a significant portion
of production currently offshored by American multinational corporations.
Trade policy can and must play an essential role in an American manufacturing
and defense industrial base renaissance. However, several major challenges in the
international trading environment are pushing America in the opposite direction.
The first challenge is rooted in MFN: the “most favored nation” rule of the World
Trade Organization (WTO). According to the MFN rule, WTO members must apply
the lowest tariffs that they apply to the products of any one country to the products
of every other country.3 However, WTO members can charge higher tariffs if they
apply these nonreciprocal tariffs to all countries.
The practical result has been the systematic exploitation of American farmers,
ranchers, manufacturers, and workers through higher tariffs institutionalized by
MFN. In turn, this unfair and nonreciprocal trade has resulted in chronic U.S. trade
deficits with much of the rest of the world. This systemic trade imbalance serves as
a brake and bridle on both GDP growth and real wages in the American economy
while encumbering the U.S. with significant foreign debt.
The second challenge is part of the broader existential threat posed by the
Chinese Communist Party (CCP) in its quest for global dominance. That challenge
is rooted in the CCP’s continued economic aggression, which begins with
mercantilist and protectionist trade policy tools such as tariffs, nontariff barriers,
dumping, counterfeiting and piracy, and currency manipulation. However, Communist
China’s economic aggression also extends to an intricate set of industrial
policies and technology transfer–forcing policies that have dramatically skewed
the international trading arena.
Both the unfair, unbalanced, and nonreciprocal trade institutionalized by the
WTO and Communist China’s economic aggression are weakening America’s manufacturing
and defense industrial base even as the fragility of globally dispersed
supply chains has been brought into sharp relief by the COVID-19 pandemic with
its associated lockdowns and other disruptions and by the Russian invasion of
Ukraine. Russian revanchism, in particular, has demonstrated once again how bad
actors on the world stage can use trade policy (for example, export restraints on
natural gas) as a weapon of war.
At this point, the author launches into a discussion of how trade deficits are prima facie evidence that the US has deindustrialized, in particular those industries important to national security.
During the first year of the Biden Administration, the overall U.S. trade deficit,
including goods and services, soared by 29 percent, from $654 billion in 2020
to $845 billion in 2021.4 Over the same time period, imports of consumer goods, capital goods, and the category of foods, feeds, and beverages were the highest on
record, and imports of industrial supplies and materials were the highest since 2014.
As for the U.S. trade deficit in goods, which primarily measures manufacturing
output, Table 1 catalogues that deficit for the top 13 countries plus the European
Union (EU) in fiscal year (FY) 2022. Note that the trade deficit in goods with Communist
China is by far the largest: It accounts for fully one-third of that deficit and
is more than twice the size of the deficit with the EU.
These trade deficit statistics implicitly measure the large amounts of America’s
manufacturing and defense industrial base and supply chains that have been
offshored to foreign lands.
As Robert Z. Lawrence once remarked to me as I was writing a memo on the trade deficit, we’re always going to have records because nominal quantities are typically rising… Here’s a picture of the trade deficit normalized by GDP:
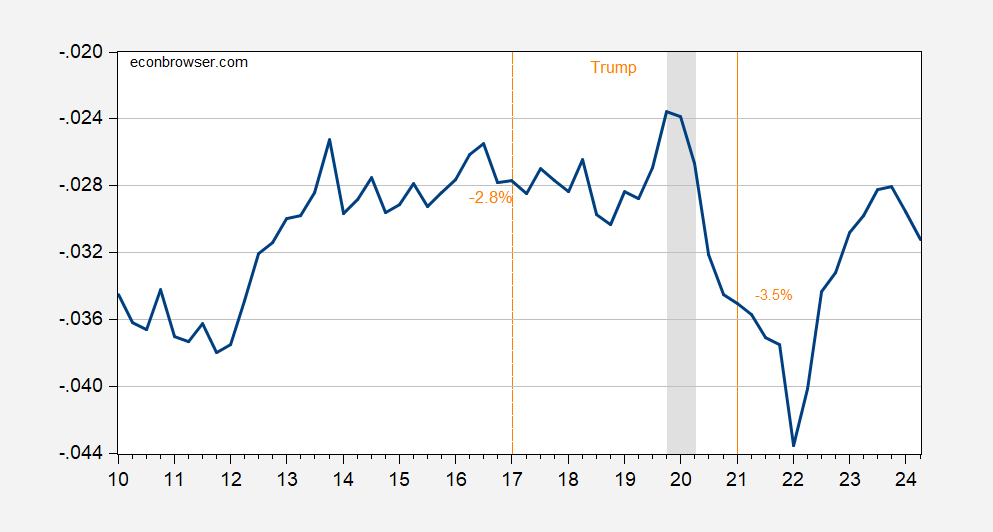
Figure 1: Net exports to GDP. NBER defined peak-to-trough recession dates shaded gray. Source: BEA, NBER.
As this picture shows, on a NIPA basis, the trade deficit was larger as a share of GDP after Trump than before Trump. This was also true after Trump vs. at the beginning of the trade war, in Q2 2018.
Navarro also argues that the manufacturing base was smaller because of the trade deficit in manufactured goods. I plot manufacturing value added vs. the capital goods + automotive trade balance (all in 2017$).
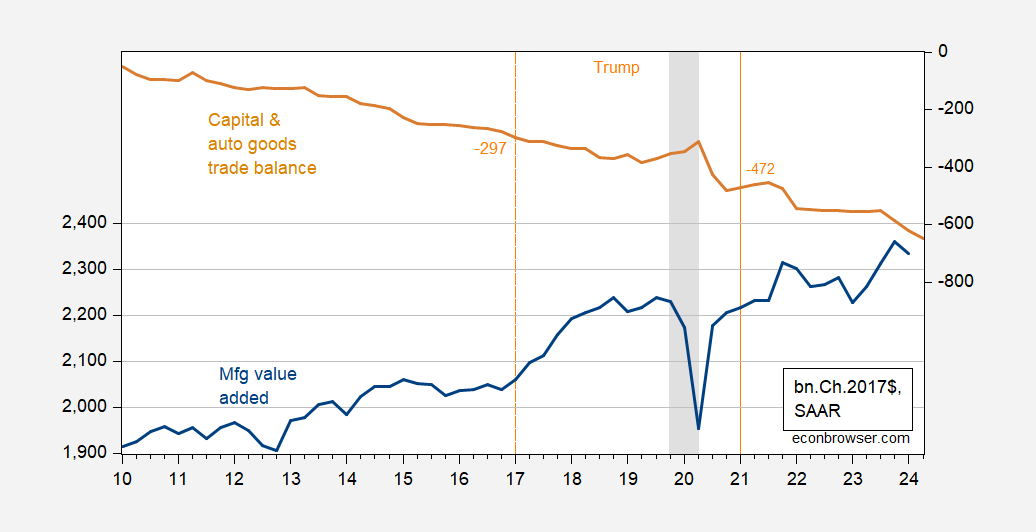
Figure 2: Manufacturing value added (blue, left scale), trade balance on capital and automotive goods (tan, right scale), both in bn.Ch.2017$ SAAR. NBER defined peak-to-trough recession dates shaded gray. Source: BEA and author’s calculations.
There’s no obvious relationship (at business cycle frequency) for a relationship between the capital and automotive goods trade balance and value added in manufacturing. Maybe value added would’ve been greater in the absence of the trade deficit, ceteris paribus. however, maybe it would’ve been larger, given imported (cheaper) inputs allow greater production.
In any case, the proposed remedy for the perceived imbalance is the US Reciprocal Trade Act, summarized by CRS thusly:
United States Reciprocal Trade Act
This bill allows the President, in certain circumstances, to (1) negotiate with a foreign country for tariff reductions on exported U.S. goods, or (2) impose additional duties on imported goods. Specifically, the President may take these actions if it is determined that the country (1) when importing a good from the United States, applies a higher rate of duty on that good than the rate imposed by the United States when imported from that country; or (2) similarly imposes other, nontariff trade restrictions on that good.
The President must terminate a rate of duty increase under this bill if the country no longer applies such higher rates or nontariff trade restrictions, or if the higher rate is no longer in the interest of the United States.
Congress may nullify a rate of duty increase implemented under this bill through a joint resolution.
This bill is effective for three years, subject to one three-year renewal.
Navarro cites the simulations run by his office, using the World Bank’s SMART tariff simulator.
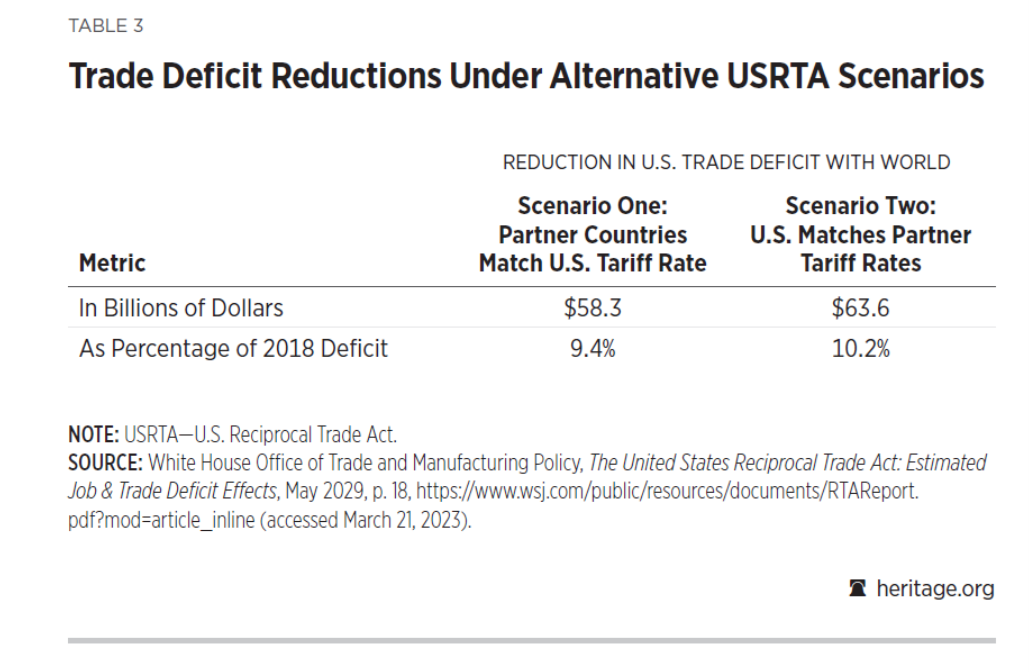
One in Table 3 assumes that our trading partners lower their applied tariff rates on specific products to U.S. levels in cases where their applied tariffs are higher. Scenario Two assumes that our trading partners refuse to lower their tariff rates to match those of the U.S. Instead, in order to uphold the principle of reciprocity, the U.S. raises its tariffs to mirror levels. To calculate the trade deficit reductions under Scenario One and Scenario Two, the analysis relied on the World Bank’s SMART tariff simulator. Table 3 provides the simulation results.
In Scenario One, if all 132 countries were to lower their higher nonreciprocal tariffs to U.S. levels, the overall U.S. trade deficit in goods would be reduced by $58.3 billion, or about 9.4 percent of that deficit. In contrast, in Scenario Two, if these countries were to refuse to reciprocate and the U.S. were to raise its tariffs to mirror those countries’ levels, the reduction in the U.S. trade deficit would be slightly larger: an estimated $63.6 billion, or 10.2 percent of the deficit. This suggests that implementing the USRTA would help to create between 350,000
and 380,000 jobs.
Here’s Table 3:
(Click on image to enlarge)
SMART is a tool within the World Bank’s World Integrated Trade System (WITS). It’s partial equilibrium, so as the tariffs change overall economic output, and other macro aggregates and prices (including exchange rates) stay fixed. This is fine for changes in tariffs covering small amounts of imports. Not so for large changes in tariffs on most goods.
I would say for such widespread tariff increases, it’s much more likely to see big macro changes, as we saw in the wake of the 2018 trade war. In 2018, the global EPU rose 60%; the elasticity of the real value of the dollar with respect to the global EPU is 0.2. That implies 12 ppts of the dollar’s strength in 2018 was attributable to the policy uncertainty spurred by the Trump trade war. Say a Trump trade war 2.0 induces a EPU jump of comparable magnitude; this would imply a 12 ppt increase in the value of the dollar, much of any expenditure switching coming from higher tariff rates. Using estimates from Chinn (2004), the dollar appreciation alone would cause a $455 billion dollar (SAAR) increase in the trade deficit (using 2024Q2 figures). 2024Q2 net exports are about -$894 billion.
For the sake of argument, suppose the affects are additive. the $455 billion dwarfs the $63 odd billions from the SMART simulation (take it up to $70 billion to account for traded goods price inflation).
The other portion of Navarro’s portion of the chapter deals with how China cheats and poses a national security threat to the United States. Actually, I agree that China trade and economic policies distort trade (particularly explicit and implicit subsidies to state owned enterprises), and even more so that China poses a national security threat in its competition in high tech. I’ll address some of those concerns (again) in another post. Suffice to say, I think tariffs and other NTBs (as used in Trump trade war 1.0) are probably too blunt and inefficient ways to deal with these threats.
For now, let me end with the following conclusions, which I largely agree with.
National Security Benefits and Costs. On the benefit side, protectionism within certain basic industries like autos, steel, and electronics helps to create and sustain and industrial base that, in times of war or national peril, can be shifted to defense purposes. However, this national security argument–and the existence of any benefits resulting from protecting these industries–can legitimately be called into question for several reasons.
First, the existence of any sizable benefits rests on the assumptions that import competition in our defense-related industries would not only reduce the size of these industries but also shrink them to the point where they would be too small to support our defense needs…
Second, it is highly possible that our defense capability might actually be enhanced–not damaged-by import competition. Without the umbrella of protectionism, our defense-related industries would be forced to operate at lowest cost, engage in more research and development, aggressively innovate to stay one step ahead of the competition, and modernize their plants at a faster pace. …
On the national security cost side, the major effect of protectionism is to threaten the stability of the international economic order through a global trade war. …
That excerpt is from Peter Navarro, The Policy Game (Wiley, 1984), p.82, on the national security/trade policy nexus.
More By This Author:
Revisiting The Recession Call Of 2022H1GDPNow Vs. WSJ July Forecast
Recession Predictions From Six Months Ago


Comments
Log in or sign up to join the conversation.