
Major Equity Indices At/Near New Highs Ahead Of 2Q Earnings; Revision Trend +VE Throughout Quarter
The 2Q earnings season begins in earnest next week. Ahead of this, major equity indices are at or near their highs. The revision trend was positive throughout the quarter. Investors heavily bought into this. Their post-earnings reaction will be telling.
The 2Q earnings season begins in earnest next week. Financials begin reporting, with JP Morgan (JPM) and Goldman Sachs (GS) on deck for Tuesday, Citigroup (C), Bank of America (BAC), and Wells Fargo (WFC) for Wednesday, and Morgan Stanley for Thursday.
Ahead of this, XLF (SPDR Financial Sector ETF) closed last Friday 3.9 percent from its June 3 record high of $38.45 and has straddled its 50-day moving average the last six sessions. The ETF is searching for direction.
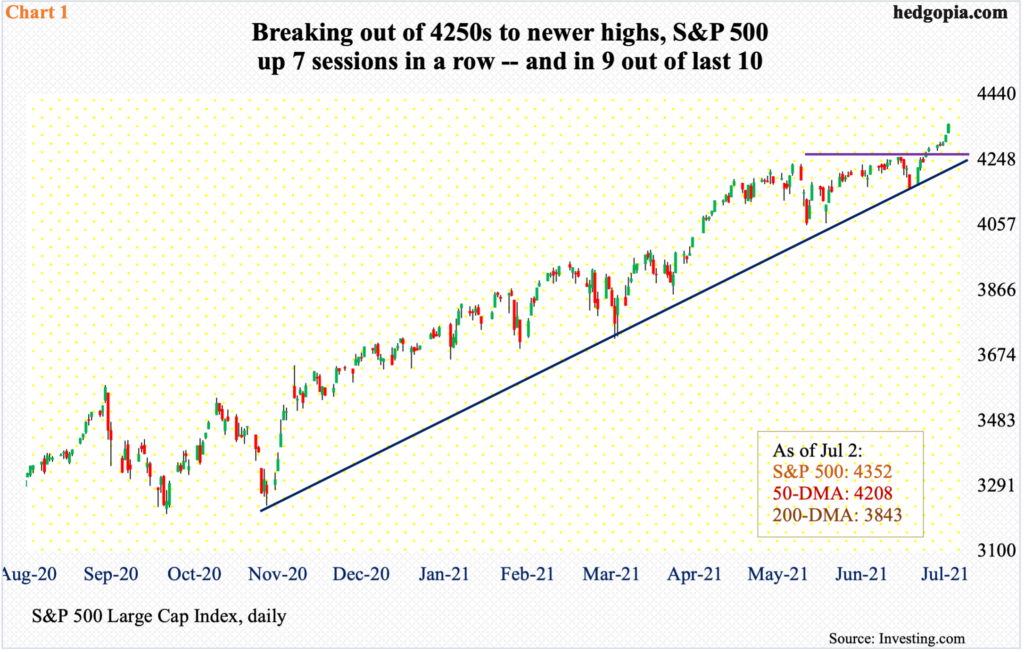
The broader indices are at/near their highs. The S&P 500, in particular, broke out of 4250s seven sessions ago, rallying in each of the last seven and in nine of the last 10, to a new high (Chart 1).
Two weeks ago when the large-cap index tested its 50-day the daily Bollinger bands had narrowed quite a bit. They are now widening, with the index rallying all along the sharply rising upper band. Conditions remain overbought, with both daily and weekly RSI now in low-70s, and monthly in mid-70s.
How the earnings season unfolds – or how it is perceived – will decide if these conditions persist or begin to unwind. Nearest support on the S&P 500 lies at 4250s.
Going into earnings, the sell-side shows conviction.
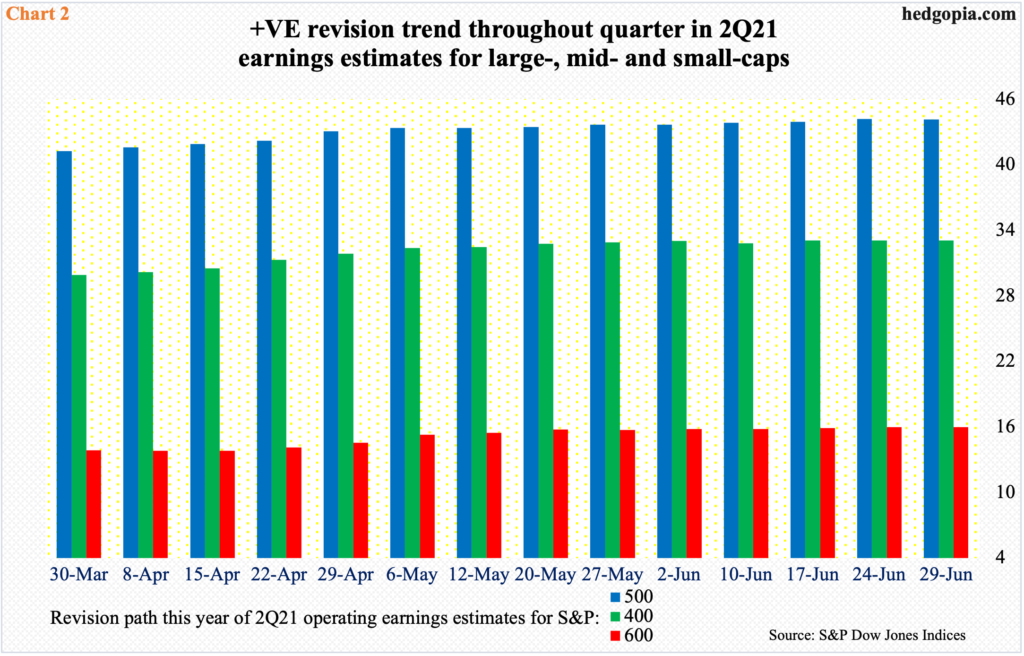
The revision trend is positive in all three market caps – large-, mid-and small.
As the March quarter ended, these analysts were expecting $41.24 in 2Q operating earnings for S&P 500 companies; by the time the quarter unwound last week, estimates had risen to $44.15. For S&P 400 and 600 companies, numbers were revised higher from $29.92 to $33.05 and from $13.84 to $15.98 respectively (Chart 2).
The positive revision trend also holds true for both this year and next.
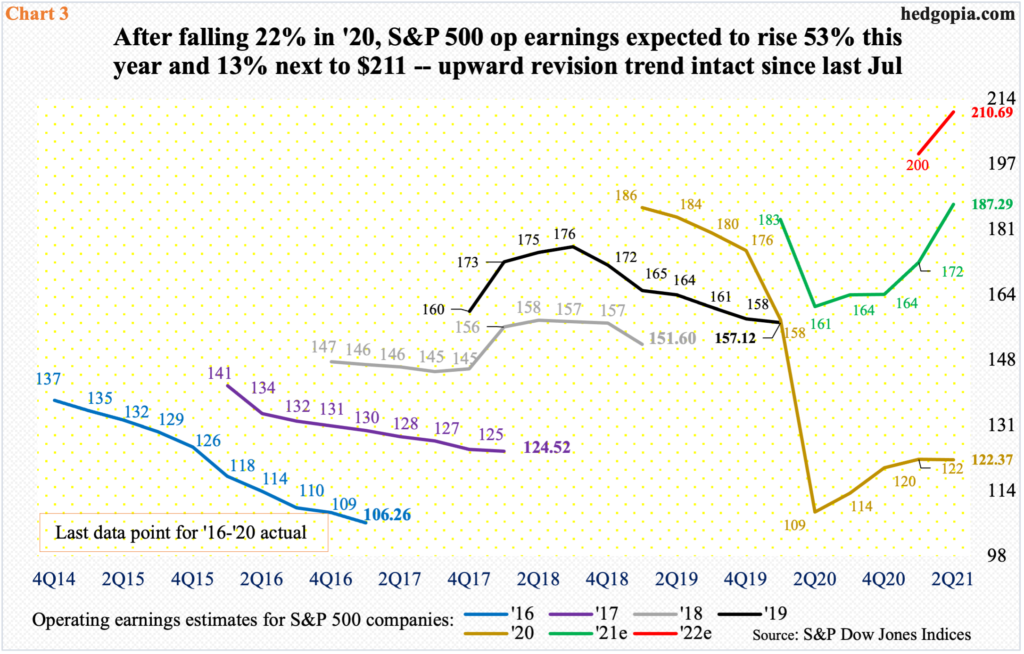
Focusing on the S&P 500, at $187.29, this year’s estimates have persistently moved higher since bottoming at $160.89 a year ago. Earlier, 2021 estimates were as high as $194.23 in January last year, hitting $187.65 in March (Chart 3 uses quarter-end figure.). In other words, after the post-pandemic free fall, the recovery in estimates has gotten back to just before the economy took a nosedive last year.
If this year’s estimates hold, earnings would have grown 53 percent. This follows a 23-percent drop in 2020. This year’s upward momentum is expected to continue next year, with the sell-side expecting a 13-percent rise.
Amid this, it is probably not a bad time to also play a ‘what if’ scenario.
The post-pandemic recovery has been nothing short of spectacular. Both manufacturing and services activity has recovered strongly. The ISM manufacturing index in June fell six-tenths of a point month-over-month to 60.6, but activity has remained north of 60 for five consecutive months and in six of the last seven. Similarly, the non-manufacturing index in May was up 1.3 points m/m to 64 – a third straight reading north of 60 (June’s numbers are due out later this morning).
Concurrently, real GDP grew at an annualized rate of 6.4 percent in 1Q. This was preceded by growth of 4.3 percent in 4Q last year and 33.4 percent in the quarter before that. The Atlanta Fed’s GDPNow model is forecasting 7.8-percent growth in the June quarter.
These numbers are so strong it makes you wonder if growth is in the process of peaking.
In recent months, inflation has been front and center. Both core CPI and PCE have put up strong numbers, with the former rising 3.8 percent and the latter 3.4 percent in the 12 months to May – the steepest readings since June and April of 1992 respectively. The majority does not believe this pace is sustainable, including the Fed which views this as transitory.
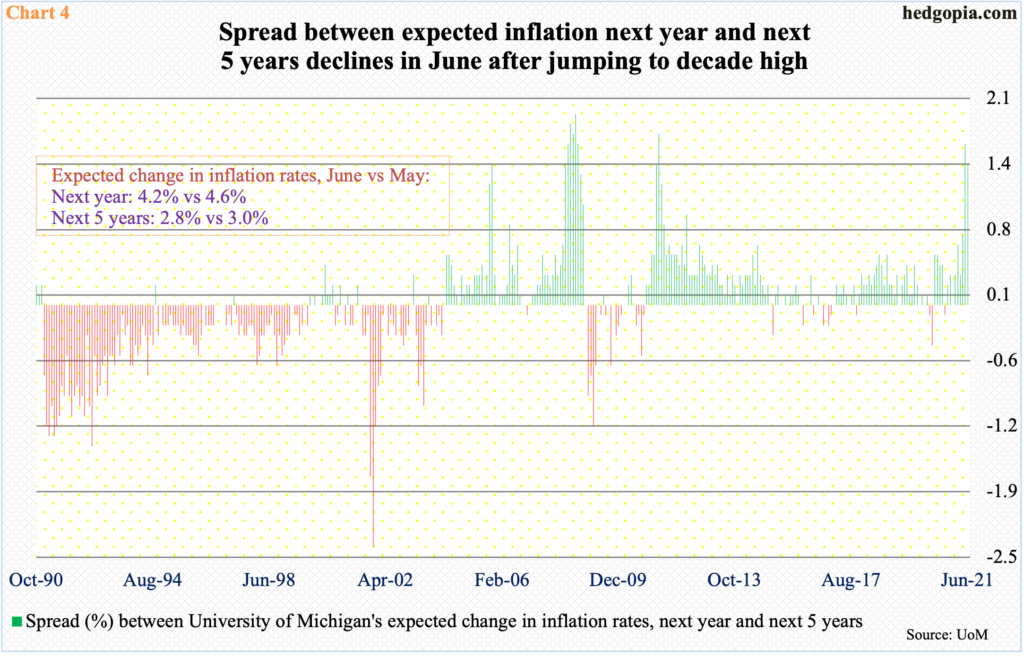
With this in the background, inflation expectations are worth a close watch. Last December, the University of Michigan’s survey respondents expected 2.5 percent inflation for both this year and five years out. This then jumped, reaching 4.6 percent and three percent in May respectively, before softening a bit in June. Last month’s readings of 4.2 percent and 2.8 percent amount to a spread of 1.4 percent and could very well be in the process of peaking (Chart 4).
If growth is peaking, then this will obviously reverberate through earnings.
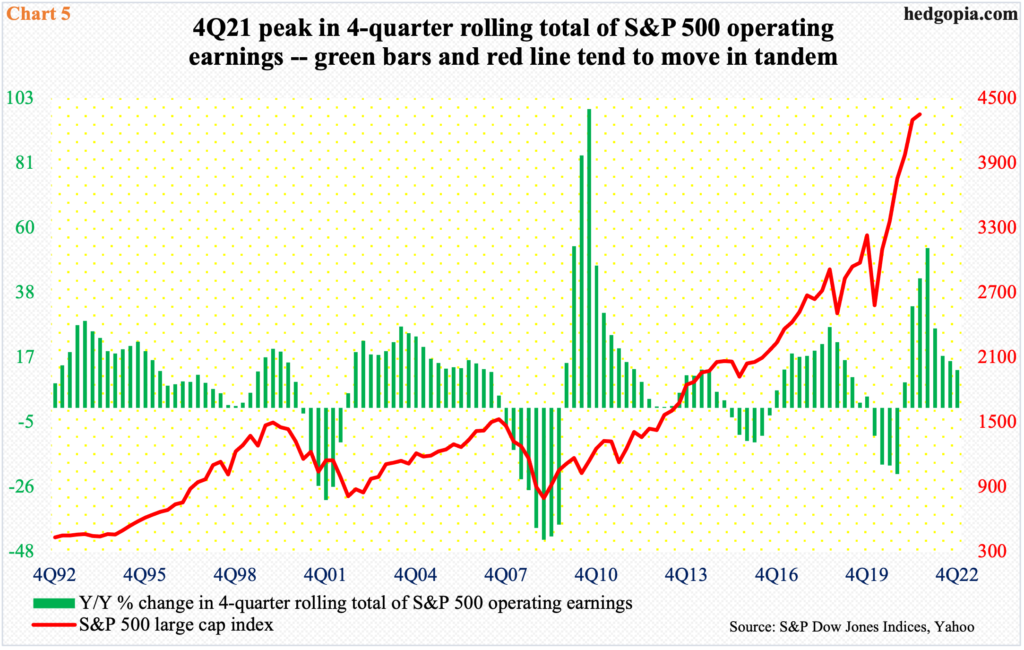
At $210.69, next year’s earnings estimates for S&P 500 companies are still trending higher. But the growth rate is on course for a peak in the fourth quarter.
Chart 5 uses year-over-year percent change in the four-quarter total of operating earnings, pitting it against the S&P 500. The relationship is not perfect but directionally they track each other, give and take a quarter or a few.
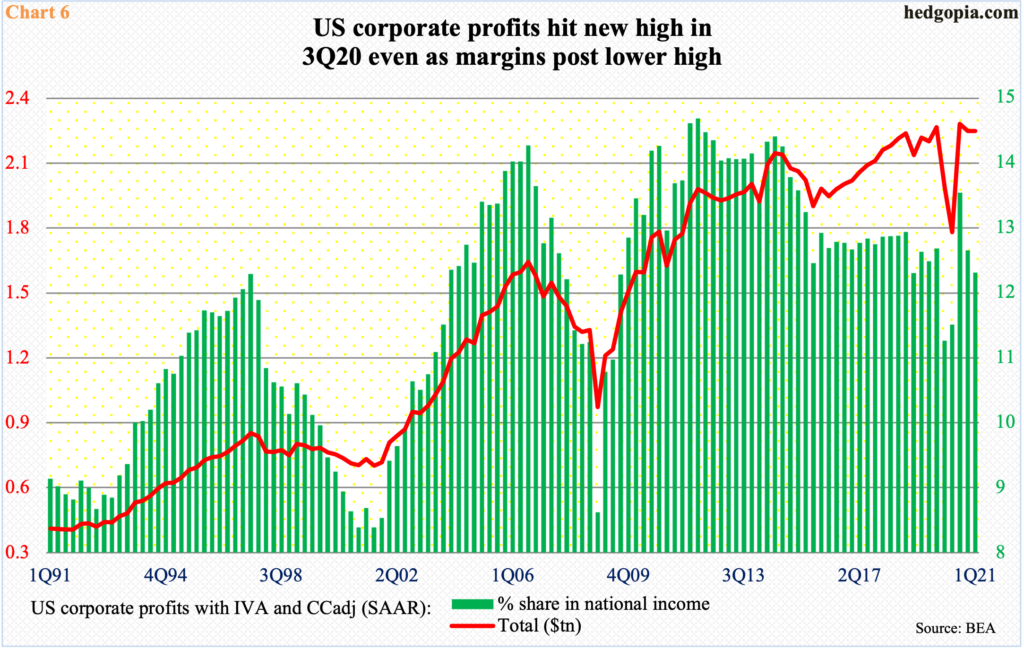
It is worth pointing out that corporate profits adjusted for inventory valuation and capital consumption slightly trended lower in a couple of quarters after peaking at a seasonally adjusted annual rate of $2.33 trillion in 3Q20, with 1Q21 at $2.29 trillion (Chart 6).
By the way, margins have diverged with the profit trend. The share of profits in national income was 12.1 percent in 1Q, down from 13.3 percent in 3Q20, with the green bars in Chart 6 no longer moving in tandem with profits.
At a time when the Fed and its monetary stimulus have mattered more than fundamentals, this may or may not matter right away but is something deserving to be kept on the back of mind.
Disclaimer: This article is not intended to be, nor shall it be construed as investment advice. Neither the information nor any opinion expressed here constitutes an offer to buy or sell any ...
more

