
Following futures positions of non-commercials are as of November 30, 2021.
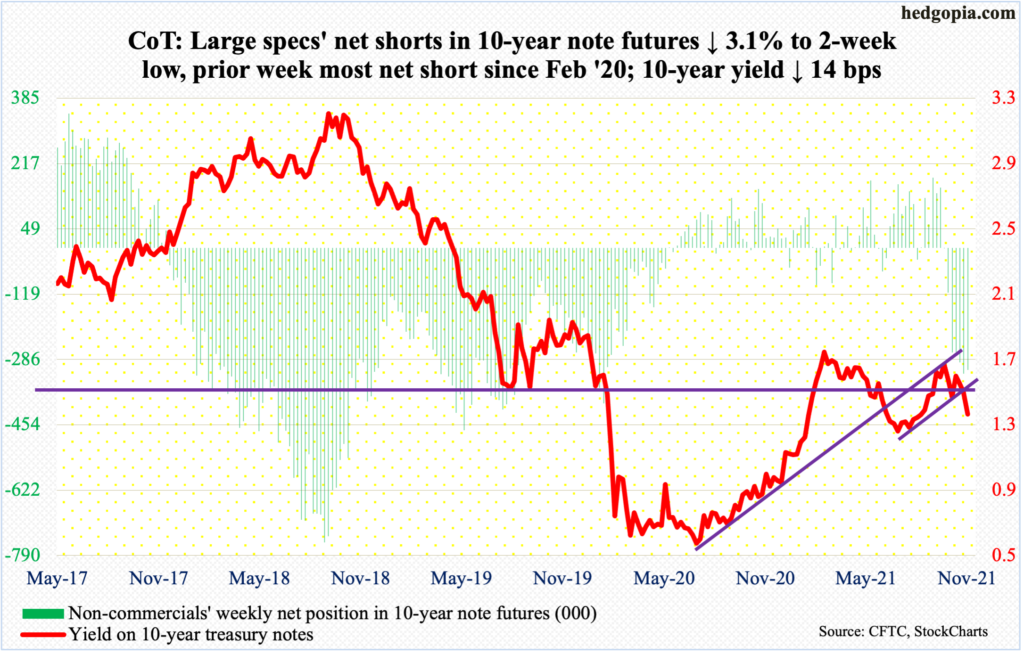
10-year note: Currently net short 313.4k, down 10k.
In the week to Wednesday, Federal Reserve assets dropped $31.4 billion from a record $8.7 trillion a week ago. In early March last year, when the central bank began padding its balance sheet, assets were $4.2 trillion.
The Fed has begun to taper its bond purchases – by $15 billion a month. It had otherwise been buying up to $120 billion worth, split between $80 billion in treasury notes and bonds and $40 billion in mortgage-backed securities (MBSs). At $15 billion/month, the quantitative easing will have come to a full stop by the middle of next year. It looks like the Fed wants to achieve that goal sooner.
Chair Jerome Powell, who just got renominated for a second term, on Tuesday said the Fed could end the program a few months sooner than currently planned. In the week to Wednesday, MBSs declined $38.8 billion week-over-week from record $2.6 trillion; treasury notes and bonds, however, rose $10.6 billion to $4.8 trillion – a fresh record. So, as far as T-notes/bonds are concerned, tapering has not yet begun.
In the meantime, Powell’s Tuesday statement probably suggests they are putting inflation risks ahead of omicron-induced slowdown risks. He made it clear he would no longer use the word “transitory” to describe inflation. It is possible the interest-rate-setting body is paying more attention to markets’ view of up to three 25-basis-point hikes in the second half next year. Powell just laid the groundwork for an interesting December 14-15 meeting. Post-November’s disappointing job creation, would he still be for accelerated tapering plans?
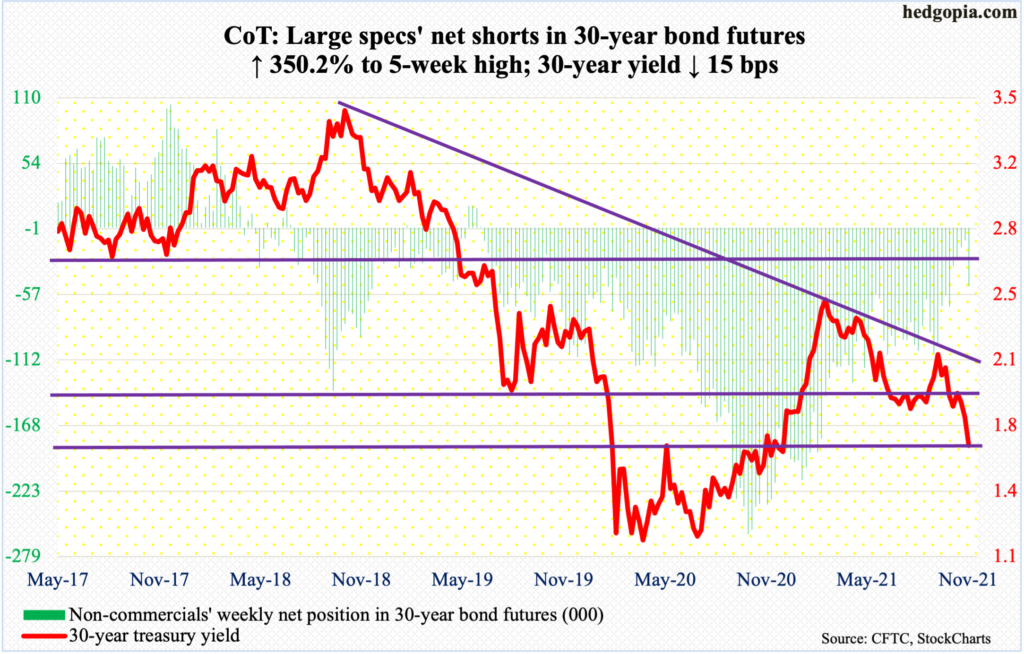
30-year bond: Currently net short 49.6k, up 38.6k.
Major economic releases for next week are as follows.
Labor productivity (3Q21, revised) comes out on Tuesday. Non-farm output/hour decreased at a seasonally adjusted annual rate of 5.1 percent in 2Q. This was the lowest pace of productivity growth since 2Q81 when it shrank 5.2 percent.
Job openings (JOLTs, October) are scheduled for Wednesday. In September, non-farm openings fell 191,000 month-over-month to 10.4 million. In July, there were as many as 11.1 million openings.
The Z.1 report (financial accounts of the US, 3Q21) will be out on Thursday. In 2Q, households’ equity ownership in their financial assets rose to 37.8 percent – a new record.
Friday brings the consumer price index (November) and the University of Michigan’s consumer sentiment index (December, preliminary).
Headline and core consumer prices in October rose 0.9 percent and 0.6 percent m/m respectively. In the 12 months to October, they respectively increased 6.2 percent and 4.6 percent; these were the steepest price rises since November 1990 and August 1991, in that order.
Consumer sentiment in November dropped 4.3 points m/m to 67.4 – a decade low.
WTI crude oil: Currently net long 414.9k, down 25.4k.
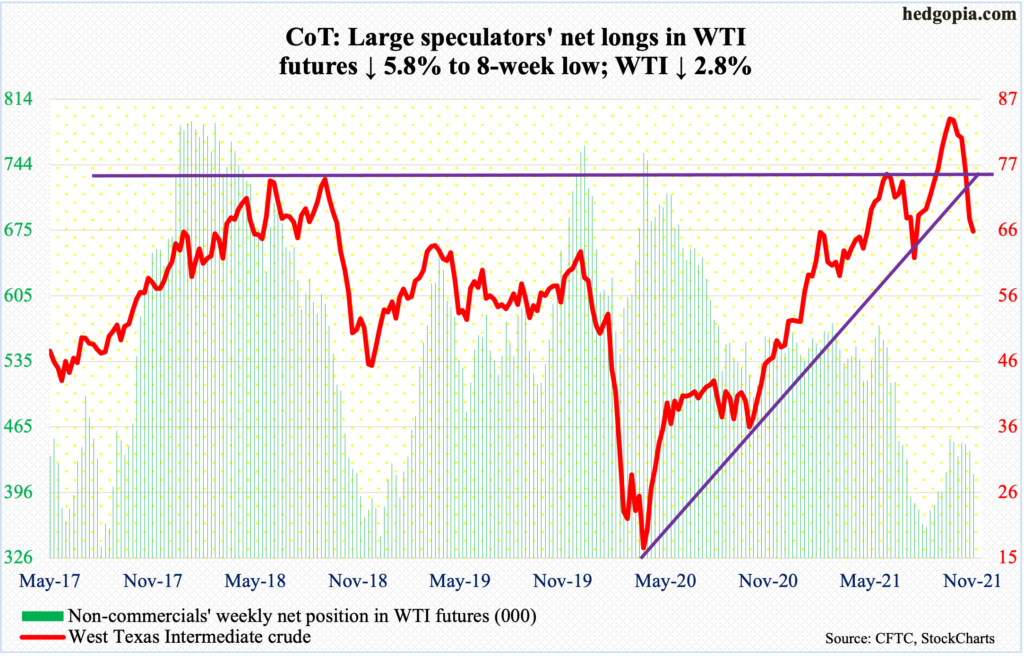
WTI suffered its sixth consecutive negative week. On October 25, the crude hit a seven-year-high $85.41/barrel. On Thursday (this week), it ticked $62.43 before drawing bids, closing at $66.50, followed by Friday’s close of $66.26. Straight-line support at $66-$67 goes back at least 16 years.
Last Friday, when the crude collapsed 13.1 percent, it lost horizontal support at $76-$77, which the crude broke out of in early October.
The daily is oversold. Conditions are ripe for a relief rally. The 200-day lies at $69.89; recapturing of the average opens the door toward a test of $76-$77.
In the meantime, the EIA data for the week to November 26 showed US crude production rose 100,000 barrels per day to 11.6 million b/d. As did crude imports, which increased 168,000 b/d to 6.6 mb/d. Stocks of gasoline and distillates grew as well – respectively up four million barrels and 2.2 million barrels to 215.4 million barrels and 123.9 million barrels. Crude stocks, however, dropped 909,000 barrels to 433.1 million barrels. Refinery utilization edged up two-tenths of a percentage point to 88.8 percent.
E-mini S&P 500: Currently net long 179.7k, up 55.9k.
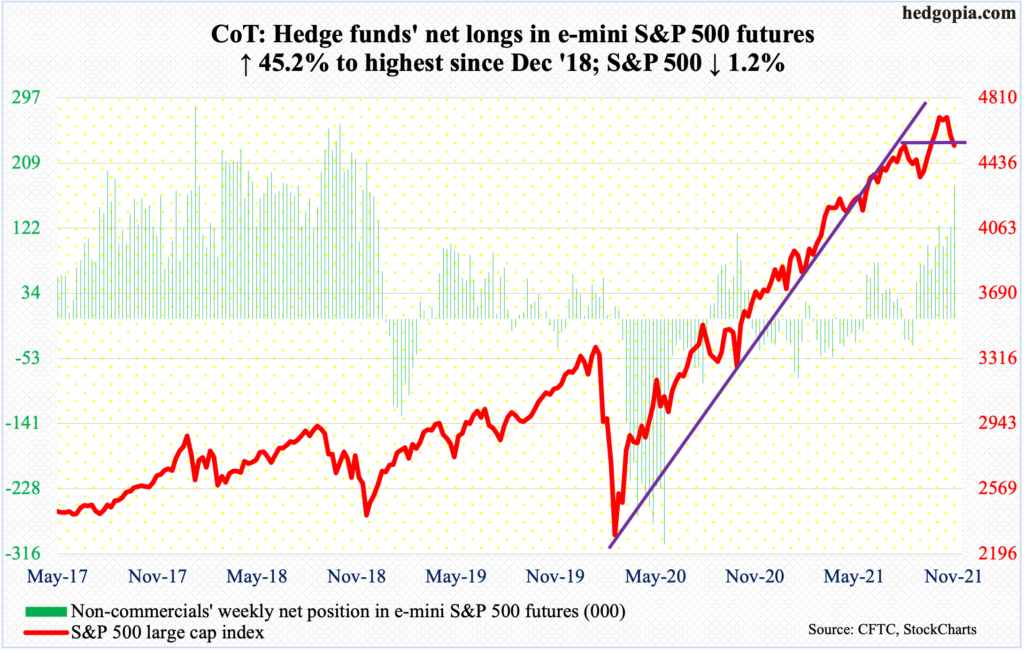
In the end, after volatile last few sessions, November ended with a monthly shooting star (more on this here). This was preceded by a bearish outside month in September, which was immediately negated by October’s bullish outside month. How December shapes can have important implications for markets.
The month started out with Wednesday’s powerful intraday reversal; the S&P 500 (4538) went from up 1.9 percent at one time to down 1.2 percent, closing at 4513. That low was undercut intraday Friday, but a 30-point rally in the last 10 minutes helped close out the week essentially right on 4540s support. The 50-day is at 4545.
From the November 22 record high of 4744 through Friday’s intraday low, the large cap index fell 5.2 percent. In a seasonally favorable period, buyers are getting tempted.
Non-commercials’ net longs are at a nearly three-year high.
In the week to Wednesday, US-based stock funds gained $13 billion (courtesy of Lipper). In the same week, SPY (SPDR S&P 500 ETF), VOO (Vanguard S&P 500 ETF) and IVV (iShares Core S&P 500 ETF) took in $8.9 billion (courtesy of ETF.com).
The daily is oversold and, assuming 4540s holds, it can rally. Immediate resistance lies at 4650s. Non-commercials can be a wildcard in this regard. They are heavily exposed on the long side. If things do not go their way soon, they can cut back, which can negatively impact the cash.
Euro: Currently net short 23.2k, up 6.8k.
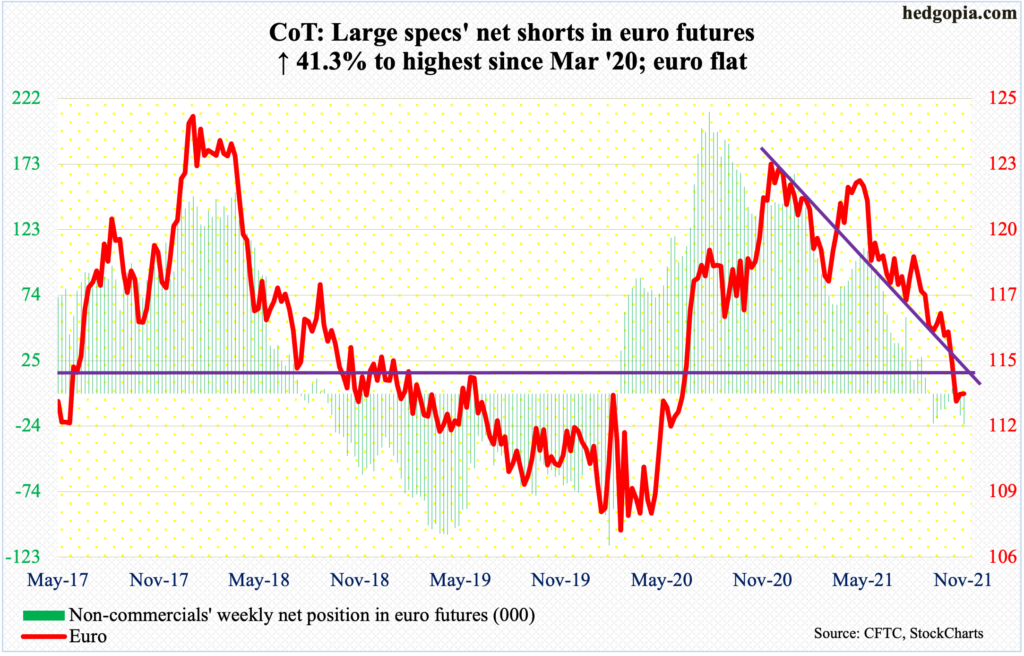
After last week’s potentially bullish hammer reversal, the euro ($1.1314) had a volatile but flat week this week, with a range of $1.1383 and $1.1235. The hammer low of $1.1186 was not even tested. Euro bulls should find this encouraging.
Earlier in January this year, the currency peaked at $1.2345. On its way to last week’s low, support at $1.14-$1.15, which goes back at least 18 years, was compromised. This is where a bull-bear duel is likely to unfold in the sessions/weeks ahead.
Gold: Currently net long 225.9k, down 8.6k.
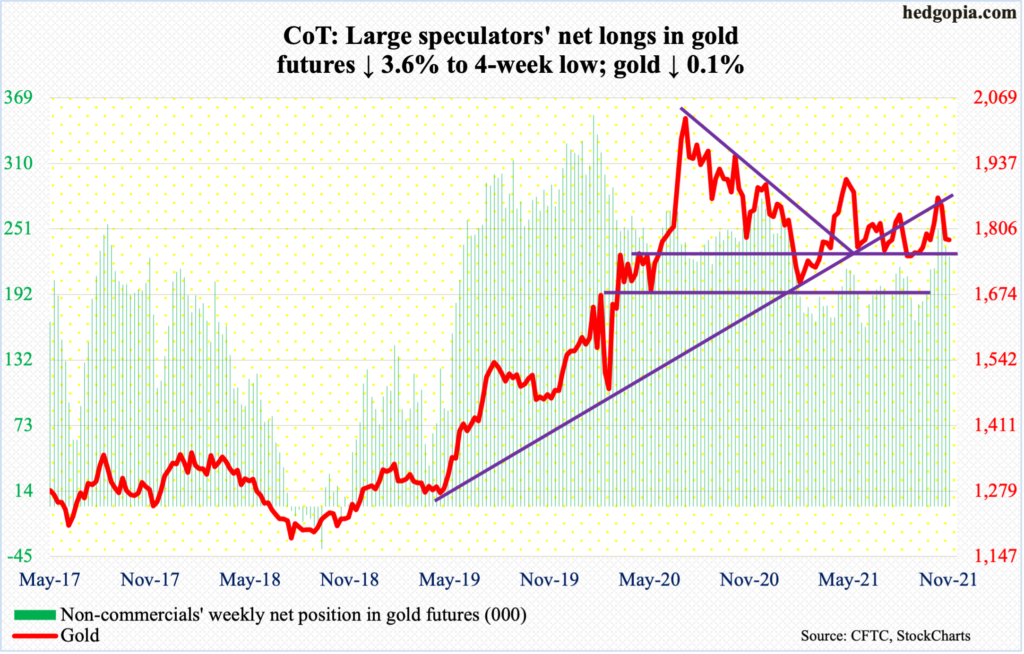
After straddling the 50- and 200-day, which are converging at $1,792, gold ($1,784/ounce) on Thursday sliced through a rising trend line from August 9 when it bottomed at $1,670s; Friday’s 1.2-percent rally placed the metal right on that trend line. The rally from the August low peaked at $1,880 on November 16.
For now, $1,760s-$1,770s remains the key level. As long as gold bugs defend this support, which by the way drew bids on Thursday, they deserve the benefit of the doubt.
Nasdaq 100 index (mini): Currently net long 33.9k, up 5.9k.
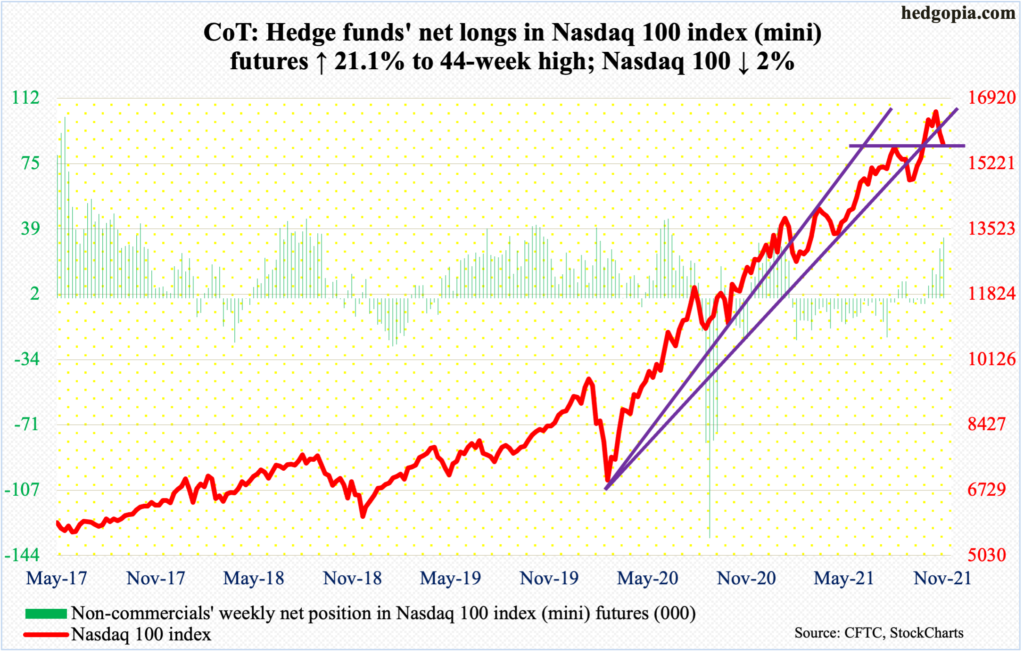
The Nasdaq 100 has produced interesting candles of late. Last week, the tech-heavy index reversed from up 1.2 percent at Monday’s new all-time high of 16765 to down 3.3 percent, ending with an outside week. In the meantime, November formed a monthly shooting star. This preceded September’s bearish outside month and October’s bullish outside month. November’s bearish candle needs confirmation.
December did not start out well; Wednesday was up 1.8 percent intraday but reversed hard to end the session down 1.6 percent. Selling continued early Thursday but bids showed up just above the September 7 high of 15701, ending the session up 0.7 percent. This is the line in the sand for now. A breach can expose the index (15712) to a test of 15100s. Friday’s 1.7-percent drop puts the index right at that support. The 50-day at 15627 lies around there as well.
Russell 2000 mini-index: Currently net short 31.1k, up 9.6k.
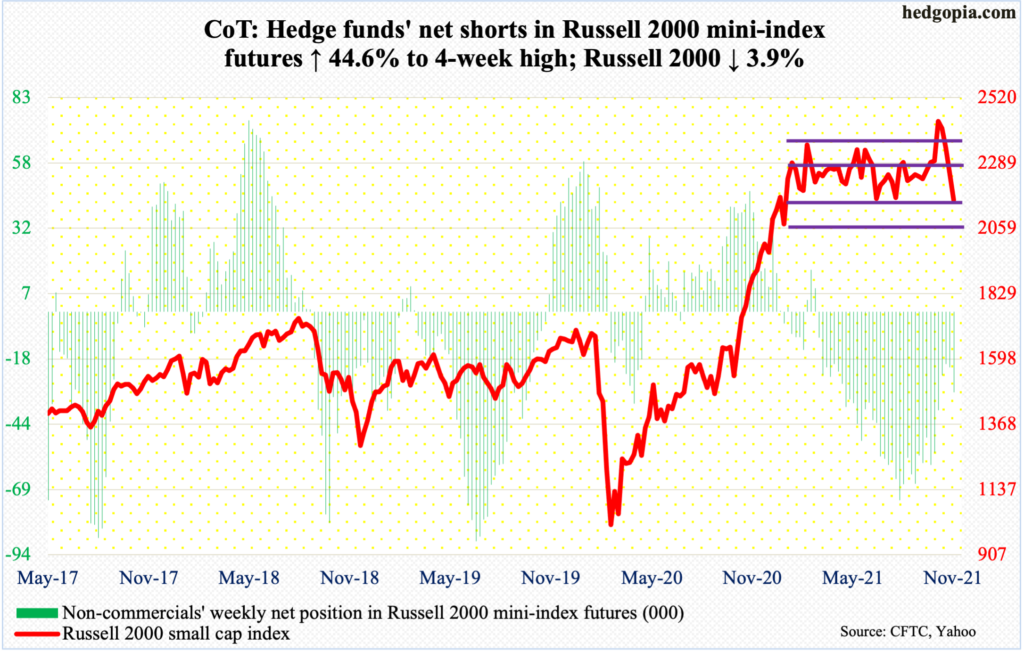
For eight and a half months now, the Russell 2000 (2159) has been rangebound between 2350s and 2080s, and between 2280s and 2150s within this rectangle. On Nov 3, the small cap index broke out, followed by a failed retest on the 19th.
If there is any consolation in all this for small-cap bulls, 2150s is holding, with buyers stepping in at 2140s on Wednesday through Friday.
The daily is oversold and can rally should 2150s not get breached. The 200-day lies at 2259. Just above that lies 2280s resistance.
US Dollar Index: Currently net long 35.9k, up 104.
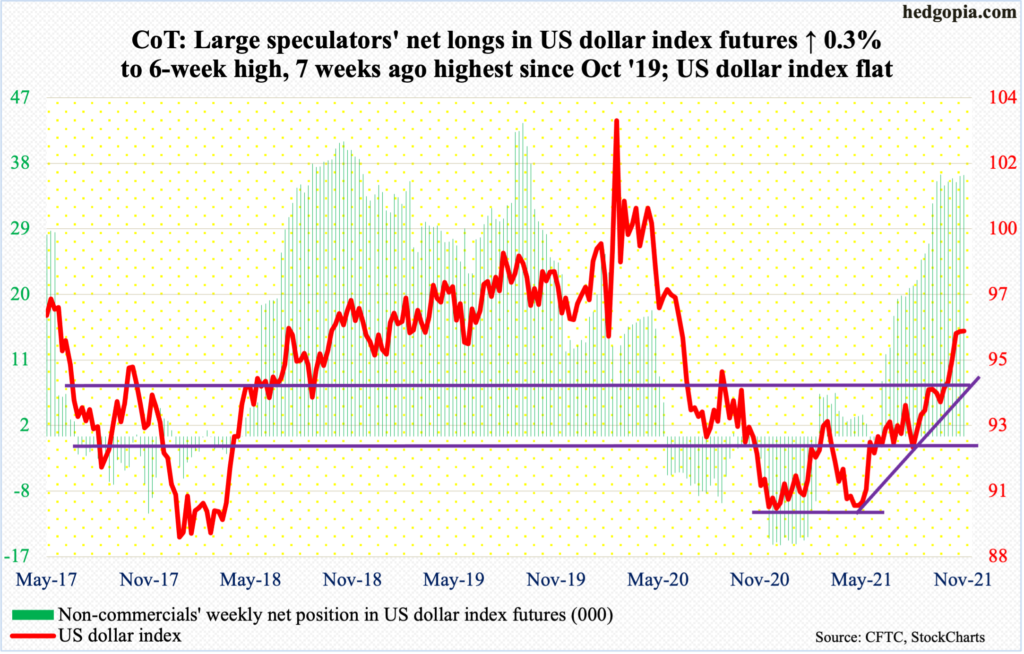
It increasingly feels like the US dollar index (96.11) is running out of steam. On May 25 (this year), it tagged 89.51 to successfully test 88-89 horizontal support. By November 24, it printed 96.94 before coming under pressure. Horizontal resistance around 97 goes back at least 18 years.
Distribution signs are popping up. A weekly gravestone doji showed up last week. This was followed by a long-legged doji this week.
Nearest decent support lies at 94.50s, which is a confluence of multi-year straight line and rising trend line from May.
VIX: Currently net short 61.2k, down 20.8k.
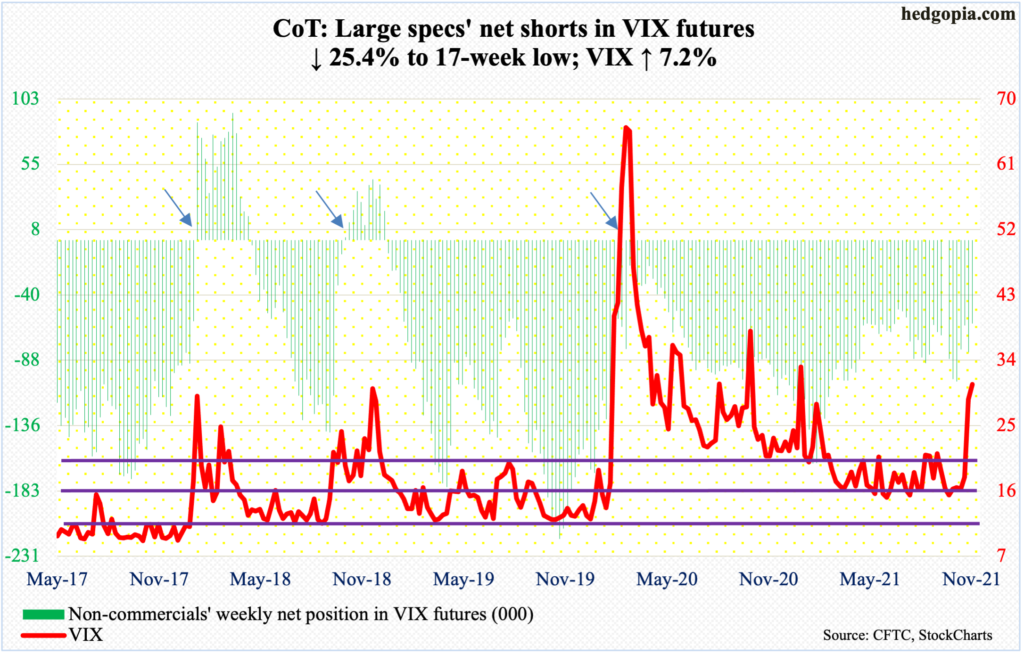
On June 29 (this year), VIX made a low of 14.10. After that low, it gradually trended higher, particularly after dropping to 14.73 on November 4. The problem with the volatility index since peaking at 85.47 in March last year is that it progressively made lower highs. This trend has now been broken. Wednesday’s intraday high of 32.61 already established a pattern of higher highs; this was superseded by Friday’s 35.32, although volatility bulls were unable to hang on to the gains, with the index closing out the week at 30.67.
For whatever it is worth, not that it is a failsafe signal, a golden cross developed this week between the 50- and 200-day. It is supposed to be bullish for volatility.
With all that said, VIX is overbought on the daily. The index more than doubled in a couple of weeks. It should not be surprising if at least some of this gets unwound. Friday’s session left behind a long upper shadow. This could very well be a spike reversal. Next week is key.


Comments
Log in or sign up to join the conversation.