

Here are the latest charts and statistics for the Commitment of Traders (COT) data published by the Commodities Futures Trading Commission (CFTC).
The latest COT data is updated through Tuesday December 13th and shows a quick view of how large traders (for-profit speculators and commercial entities) were positioned in the futures markets.
Weekly Speculator Changes led by Gold & Silver
(Click on image to enlarge)
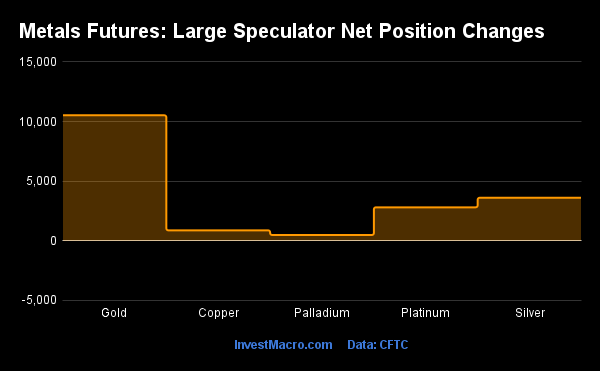
The COT metals markets speculator bets were higher this week as five out of the five precious metals markets we cover had higher positioning.
Free Reports:
 Get our Weekly Commitment of Traders Reports - See where the biggest traders (Hedge Funds and Commercial Hedgers) are positioned in the futures markets on a weekly basis.
 Sign Up for Our Stock Market Newsletter – Get updated on News, Charts & Rankings of Public Companies when you join our Stocks Newsletter
Leading the gains for the metals was Gold (10,524 contracts) with Silver (3,611 contracts), Platinum (2,809 contracts), Copper (877 contracts) and Palladium (489 contracts) all showing positive weeks.
Highlighting the COT metals data this week is the gains in bets for the Gold positions. The large speculator position in Gold futures rose this week for a second straight week and for the fourth time over the past six weeks. Speculator bets have now increased by a total of +61,026 contracts over these past six weeks, going from a total of +64,623 contracts on November 1st to a total of +125,649 contracts this week. These recent gains have now put the net position above +100,000 for the fifth straight week after having been below that threshold for nine consecutive weeks (from September 13th to November 8th) which was the longest stretch under +100,000 net contracts since 2018.
The Gold futures price has been moving positively as well with prices closing higher on a weekly basis for five out of the past seven weeks. The Gold price hit a recent bottom at the $1,618.30 level in early November and has rallied by approximately 11 percent since then to close out this week slightly above the $1,800.00 price threshold.
|
Dec-13-2022
|
OI
|
OI-Index
|
Spec-Net
|
Spec-Index
|
Com-Net
|
COM-Index
|
Smalls-Net
|
Smalls-Index
|
|---|---|---|---|---|---|---|---|---|
| Gold | 437,040 | 4 | 125,649 | 24 | -138,529 | 76 | 12,880 | 12 |
| Copper | 162,191 | 11 | 2,556 | 38 | -6,559 | 62 | 4,003 | 48 |
| Silver | 125,555 | 4 | 22,819 | 39 | -35,806 | 61 | 12,987 | 33 |
| Platinum | 72,416 | 43 | 28,445 | 47 | -32,624 | 55 | 4,179 | 24 |
| Palladium | 7,494 | 8 | -883 | 20 | 854 | 77 | 29 | 43 |
Strength Scores led by Platinum & Silver
(Click on image to enlarge)
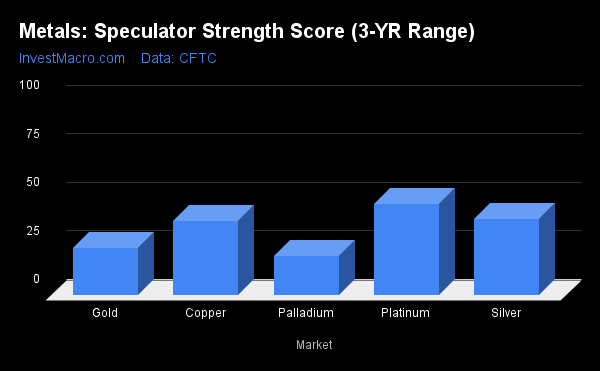
COT Strength Scores (a normalized measure of Speculator positions over a 3-Year range, from 0 to 100 where above 80 is Extreme-Bullish and below 20 is Extreme-Bearish) showed that Platinum (47 percent) leads the metals markets this week. Silver (39 percent) comes in as the next highest in the weekly strength scores.
On the downside, Palladium (20 percent) comes in at the lowest strength level currently while the next lowest strength score was Gold (24 percent).
Strength Statistics:
Gold (24.4 percent) vs Gold previous week (20.9 percent)
Silver (39.3 percent) vs Silver previous week (35.3 percent)
Copper (38.4 percent) vs Copper previous week (37.7 percent)
Platinum (47.3 percent) vs Platinum previous week (43.6 percent)
Palladium (20.3 percent) vs Palladium previous week (17.2 percent)
Silver & Gold top the 6-Week Strength Trends
(Click on image to enlarge)

COT Strength Score Trends (or move index, calculates the 6-week changes in strength scores) showed that Silver (23 percent) leads the past six weeks trends for metals. Gold (20 percent) is the next highest positive mover in the latest trends data.
Palladium (6 percent) is the lowest in trend scores currently with Copper (8 percent) coming in next. The all positive movement score underlines the change of sentiment for the metals category after spending many weeks of 2022 with all or most of the metals with negative trends.
Move Statistics:
Gold (20.2 percent) vs Gold previous week (15.6 percent)
Silver (23.5 percent) vs Silver previous week (21.3 percent)
Copper (8.0 percent) vs Copper previous week (14.8 percent)
Platinum (16.8 percent) vs Platinum previous week (19.2 percent)
Palladium (6.3 percent) vs Palladium previous week (2.4 percent)
Individual Markets:
Gold Comex Futures:
(Click on image to enlarge)
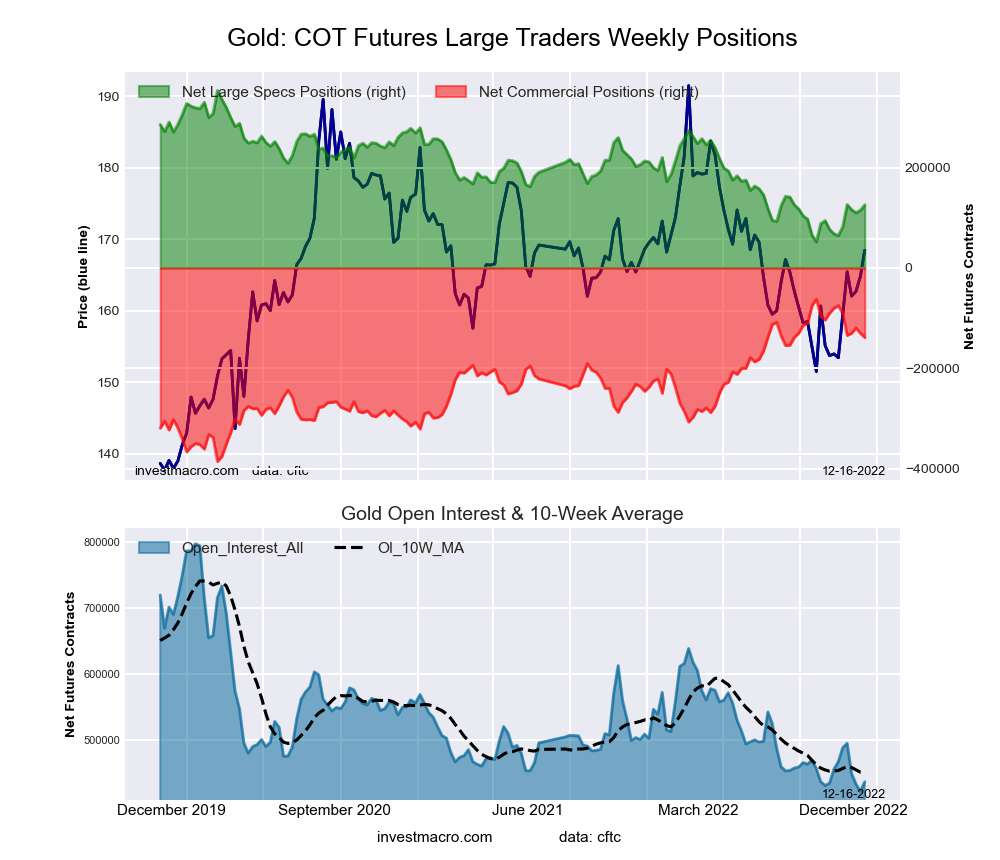
The Gold Comex Futures large speculator standing this week equaled a net position of 125,649 contracts in the data reported through Tuesday. This was a weekly increase of 10,524 contracts from the previous week which had a total of 115,125 net contracts.
This week’s current strength score (the trader positioning range over the past three years, measured from 0 to 100) shows the speculators are currently Bearish with a score of 24.4 percent. The commercials are Bullish with a score of 76.4 percent and the small traders (not shown in chart) are Bearish-Extreme with a score of 12.2 percent.
| Gold Futures Statistics | SPECULATORS | COMMERCIALS | SMALL TRADERS |
| – Percent of Open Interest Longs: | 51.3 | 27.4 | 8.5 |
| – Percent of Open Interest Shorts: | 22.6 | 59.1 | 5.6 |
| – Net Position: | 125,649 | -138,529 | 12,880 |
| – Gross Longs: | 224,409 | 119,908 | 37,309 |
| – Gross Shorts: | 98,760 | 258,437 | 24,429 |
| – Long to Short Ratio: | 2.3 to 1 | 0.5 to 1 | 1.5 to 1 |
| NET POSITION TREND: | |||
| – Strength Index Score (3 Year Range Pct): | 24.4 | 76.4 | 12.2 |
| – Strength Index Reading (3 Year Range): | Bearish | Bullish | Bearish-Extreme |
| NET POSITION MOVEMENT INDEX: | |||
| – 6-Week Change in Strength Index: | 20.2 | -19.7 | 6.8 |
Silver Comex Futures:
(Click on image to enlarge)
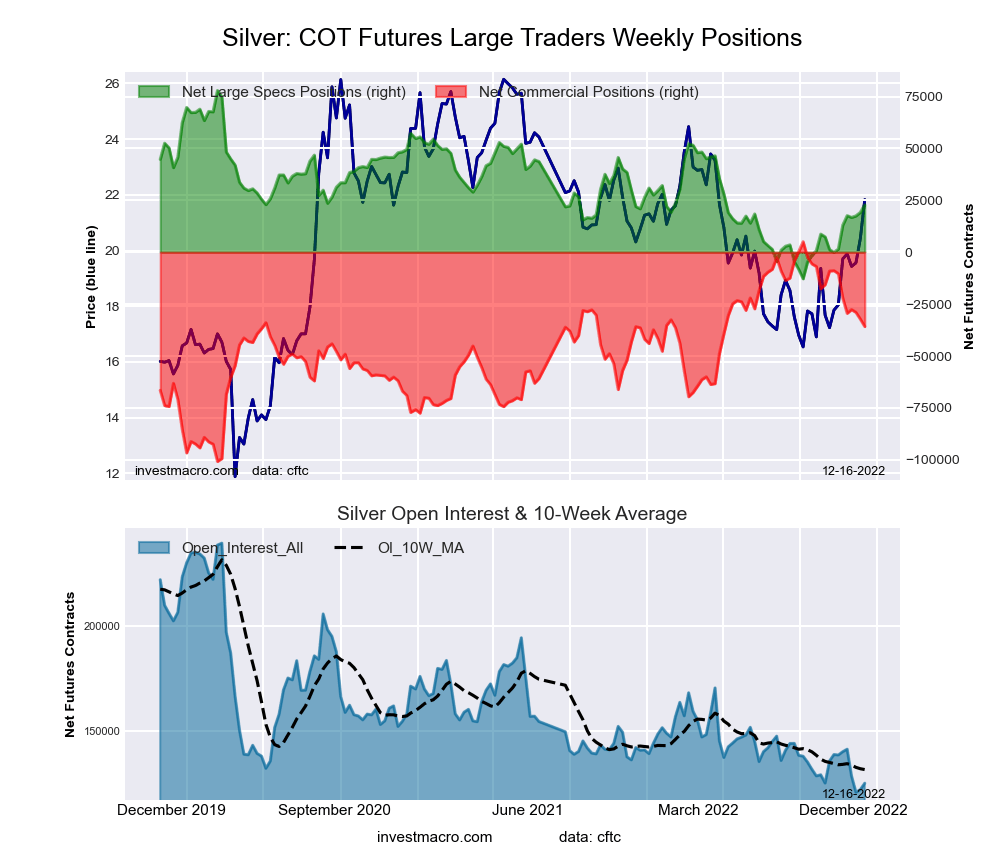
The Silver Comex Futures large speculator standing this week equaled a net position of 22,819 contracts in the data reported through Tuesday. This was a weekly lift of 3,611 contracts from the previous week which had a total of 19,208 net contracts.
This week’s current strength score (the trader positioning range over the past three years, measured from 0 to 100) shows the speculators are currently Bearish with a score of 39.3 percent. The commercials are Bullish with a score of 61.4 percent and the small traders (not shown in chart) are Bearish with a score of 33.1 percent.
| Silver Futures Statistics | SPECULATORS | COMMERCIALS | SMALL TRADERS |
| – Percent of Open Interest Longs: | 40.9 | 35.8 | 19.0 |
| – Percent of Open Interest Shorts: | 22.8 | 64.3 | 8.6 |
| – Net Position: | 22,819 | -35,806 | 12,987 |
| – Gross Longs: | 51,405 | 44,913 | 23,843 |
| – Gross Shorts: | 28,586 | 80,719 | 10,856 |
| – Long to Short Ratio: | 1.8 to 1 | 0.6 to 1 | 2.2 to 1 |
| NET POSITION TREND: | |||
| – Strength Index Score (3 Year Range Pct): | 39.3 | 61.4 | 33.1 |
| – Strength Index Reading (3 Year Range): | Bearish | Bullish | Bearish |
| NET POSITION MOVEMENT INDEX: | |||
| – 6-Week Change in Strength Index: | 23.5 | -24.0 | 19.9 |
Copper Grade #1 Futures:
(Click on image to enlarge)
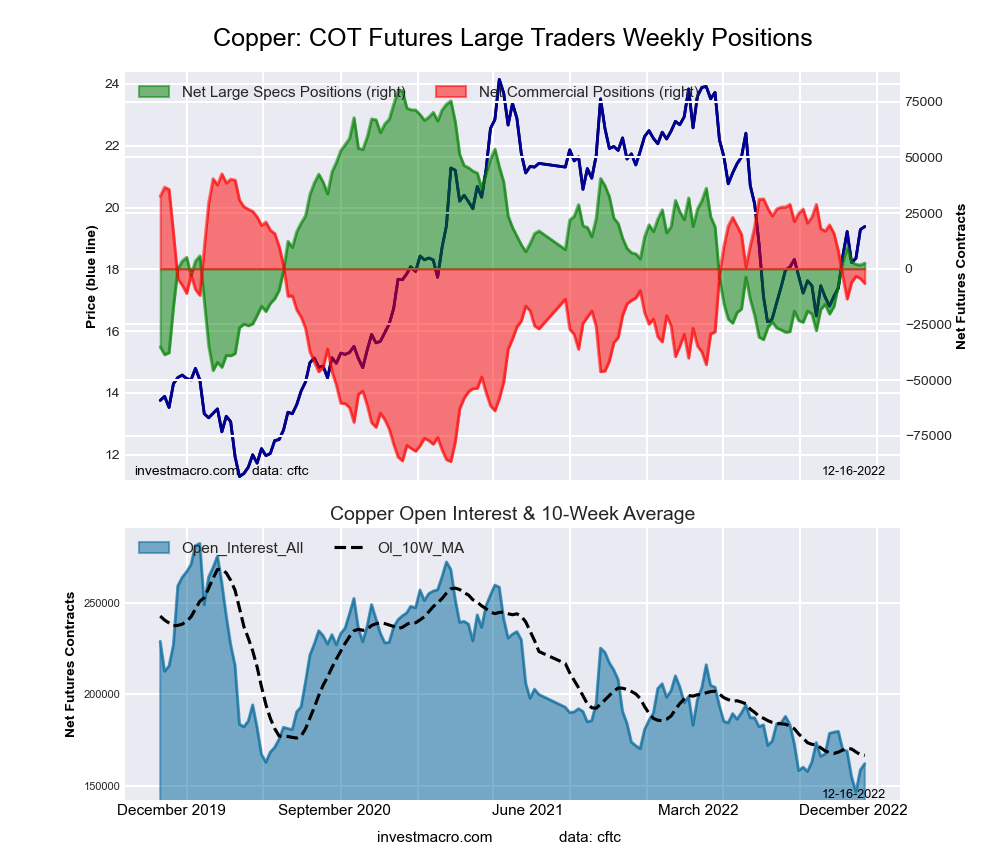
The Copper Grade #1 Futures large speculator standing this week equaled a net position of 2,556 contracts in the data reported through Tuesday. This was a weekly advance of 877 contracts from the previous week which had a total of 1,679 net contracts.
This week’s current strength score (the trader positioning range over the past three years, measured from 0 to 100) shows the speculators are currently Bearish with a score of 38.4 percent. The commercials are Bullish with a score of 61.9 percent and the small traders (not shown in chart) are Bearish with a score of 48.4 percent.
| Copper Futures Statistics | SPECULATORS | COMMERCIALS | SMALL TRADERS |
| – Percent of Open Interest Longs: | 35.8 | 40.9 | 10.3 |
| – Percent of Open Interest Shorts: | 34.2 | 44.9 | 7.9 |
| – Net Position: | 2,556 | -6,559 | 4,003 |
| – Gross Longs: | 58,057 | 66,265 | 16,760 |
| – Gross Shorts: | 55,501 | 72,824 | 12,757 |
| – Long to Short Ratio: | 1.0 to 1 | 0.9 to 1 | 1.3 to 1 |
| NET POSITION TREND: | |||
| – Strength Index Score (3 Year Range Pct): | 38.4 | 61.9 | 48.4 |
| – Strength Index Reading (3 Year Range): | Bearish | Bullish | Bearish |
| NET POSITION MOVEMENT INDEX: | |||
| – 6-Week Change in Strength Index: | 8.0 | -11.3 | 26.1 |
Platinum Futures:
(Click on image to enlarge)
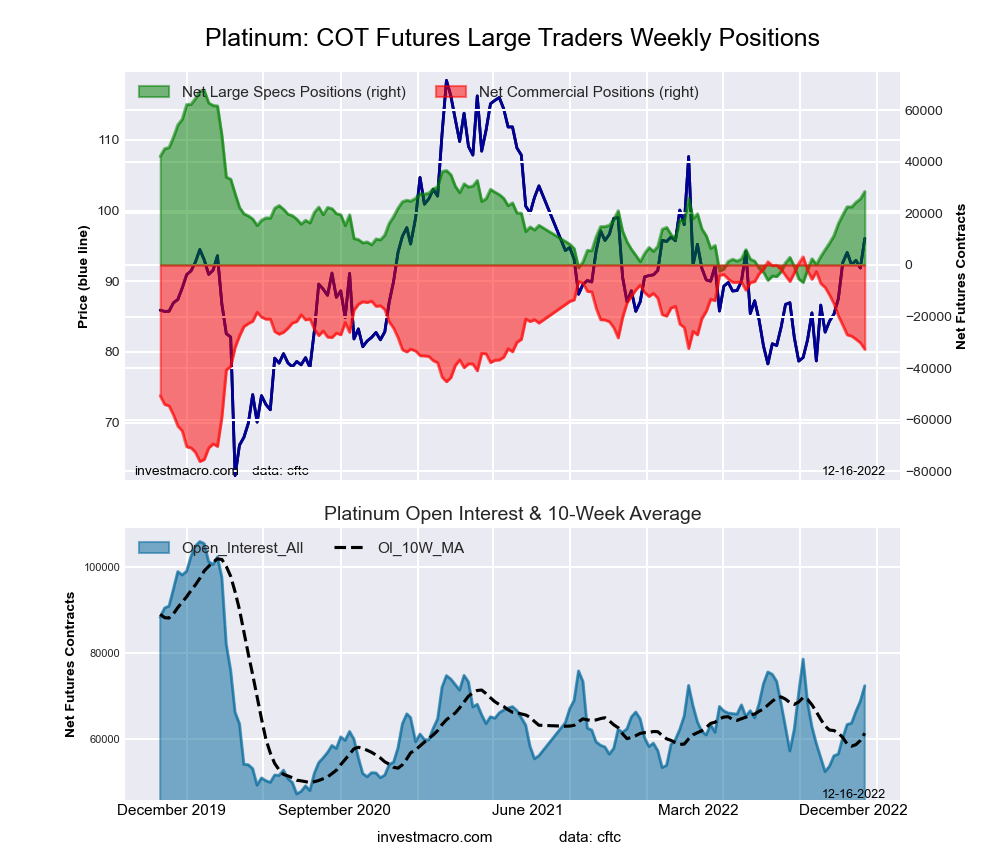
The Platinum Futures large speculator standing this week equaled a net position of 28,445 contracts in the data reported through Tuesday. This was a weekly lift of 2,809 contracts from the previous week which had a total of 25,636 net contracts.
This week’s current strength score (the trader positioning range over the past three years, measured from 0 to 100) shows the speculators are currently Bearish with a score of 47.3 percent. The commercials are Bullish with a score of 54.9 percent and the small traders (not shown in chart) are Bearish with a score of 24.1 percent.
| Platinum Futures Statistics | SPECULATORS | COMMERCIALS | SMALL TRADERS |
| – Percent of Open Interest Longs: | 54.0 | 29.0 | 10.3 |
| – Percent of Open Interest Shorts: | 14.7 | 74.1 | 4.5 |
| – Net Position: | 28,445 | -32,624 | 4,179 |
| – Gross Longs: | 39,112 | 21,003 | 7,434 |
| – Gross Shorts: | 10,667 | 53,627 | 3,255 |
| – Long to Short Ratio: | 3.7 to 1 | 0.4 to 1 | 2.3 to 1 |
| NET POSITION TREND: | |||
| – Strength Index Score (3 Year Range Pct): | 47.3 | 54.9 | 24.1 |
| – Strength Index Reading (3 Year Range): | Bearish | Bullish | Bearish |
| NET POSITION MOVEMENT INDEX: | |||
| – 6-Week Change in Strength Index: | 16.8 | -16.3 | 6.3 |
Palladium Futures:
(Click on image to enlarge)
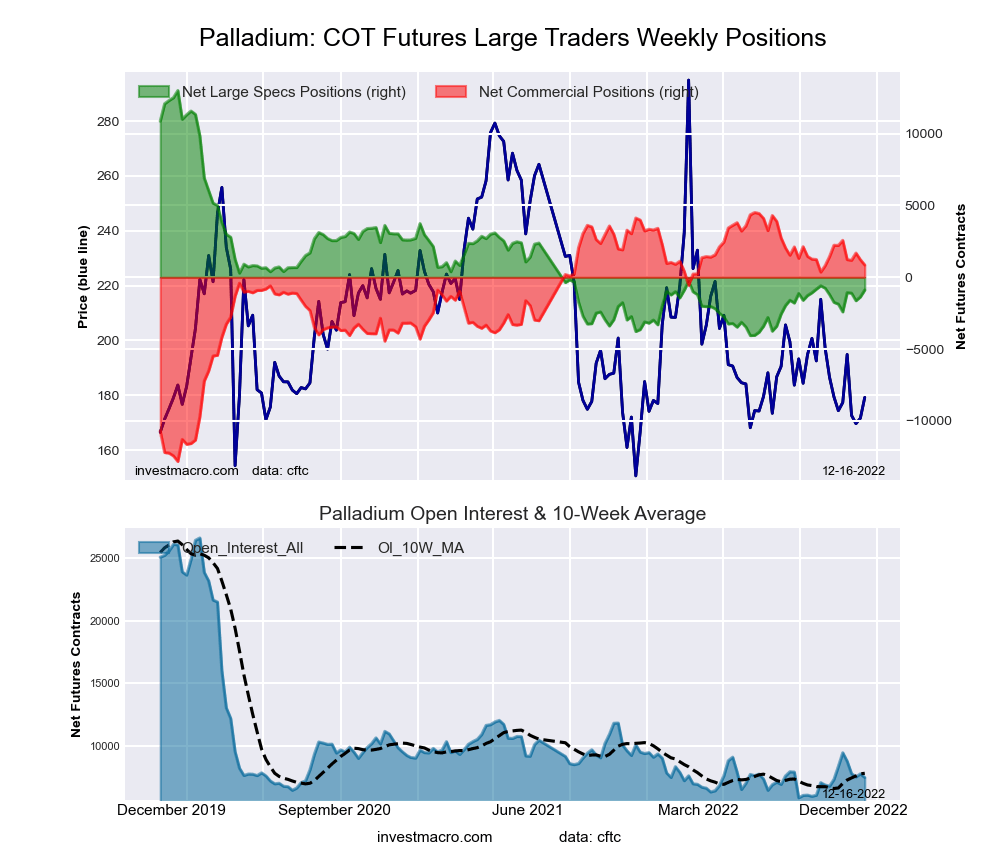
The Palladium Futures large speculator standing this week equaled a net position of -883 contracts in the data reported through Tuesday. This was a weekly rise of 489 contracts from the previous week which had a total of -1,372 net contracts.
This week’s current strength score (the trader positioning range over the past three years, measured from 0 to 100) shows the speculators are currently Bearish with a score of 20.3 percent. The commercials are Bullish with a score of 77.3 percent and the small traders (not shown in chart) are Bearish with a score of 43.4 percent.
| Palladium Futures Statistics | SPECULATORS | COMMERCIALS | SMALL TRADERS |
| – Percent of Open Interest Longs: | 32.9 | 48.6 | 14.0 |
| – Percent of Open Interest Shorts: | 44.7 | 37.2 | 13.6 |
| – Net Position: | -883 | 854 | 29 |
| – Gross Longs: | 2,466 | 3,644 | 1,050 |
| – Gross Shorts: | 3,349 | 2,790 | 1,021 |
| – Long to Short Ratio: | 0.7 to 1 | 1.3 to 1 | 1.0 to 1 |
| NET POSITION TREND: | |||
| – Strength Index Score (3 Year Range Pct): | 20.3 | 77.3 | 43.4 |
| – Strength Index Reading (3 Year Range): | Bearish | Bullish | Bearish |
| NET POSITION MOVEMENT INDEX: | |||
| – 6-Week Change in Strength Index: | 6.3 | -8.5 | 23.0 |
Article By InvestMacro – Receive our weekly COT Newsletter
*COT Report: The COT data, released weekly to the public each Friday, is updated through the most recent Tuesday (data is 3 days old) and shows a quick view of how large speculators or non-commercials (for-profit traders) were positioned in the futures markets.
The CFTC categorizes trader positions according to commercial hedgers (traders who use futures contracts for hedging as part of the business), non-commercials (large traders who speculate to realize trading profits) and nonreportable traders (usually small traders/speculators) as well as their open interest (contracts open in the market at time of reporting). See CFTC criteria here.
More By This Author:
COT Bonds Speculators Drop 5-Year Treasury Bets To 215-Week Low
COT Soft Commodities Speculators Drop Corn Bullish Bets To 19-Week Low
COT Metals Speculators Boosted Their Silver Bullish Bets To 30-Week High


Comments
Log in or sign up to join the conversation.