
(Click on image to enlarge)

Labor productivity and costs (quarterly percent changes are at seasonally adjusted annual rates.) Chart from the BLS, highlights by Mish
Please consider Productivity and Costs for the Second Quarter 2023, Preliminary.
- Nonfarm business sector labor productivity increased 3.7 percent in the second quarter of 2023 as output increased 2.4 percent and hours worked decreased 1.3 percent.
- The decline in hours worked is the first decline since the second quarter of 2020 and was the result of a 1.3-percent decline in average weekly hours; employment was unchanged.
- From the same quarter a year ago, nonfarm business sector labor productivity increased 1.3 percent, reflecting a 2.6-percent increase in output and a 1.2-percent increase in hours worked;
- This is the first increase in the four-quarter productivity measure since the fourth quarter of 2021.
Unit Labor Costs
- Unit labor costs in the nonfarm business sector increased 1.6 percent in the second quarter of 2023, reflecting a 5.5-percent increase in hourly compensation and a 3.7-percent increase in productivity.
- Unit labor costs increased 2.4 percent over the last four quarters.
- BLS calculates unit labor costs as the ratio of hourly compensation to labor productivity. Increases in hourly compensation tend to increase unit labor costs and increases in productivity tend to reduce them.
- Real hourly compensation, which takes into account consumer prices, increased 2.7 percent in the second quarter of 2023, and declined 0.3 percent over the last four quarters.
- Labor productivity, or output per hour, is calculated by dividing an index of real output by an index of hours worked by all workers, including employees, proprietors, and unpaid family workers.
Labor Productivity vs Costs Long Term
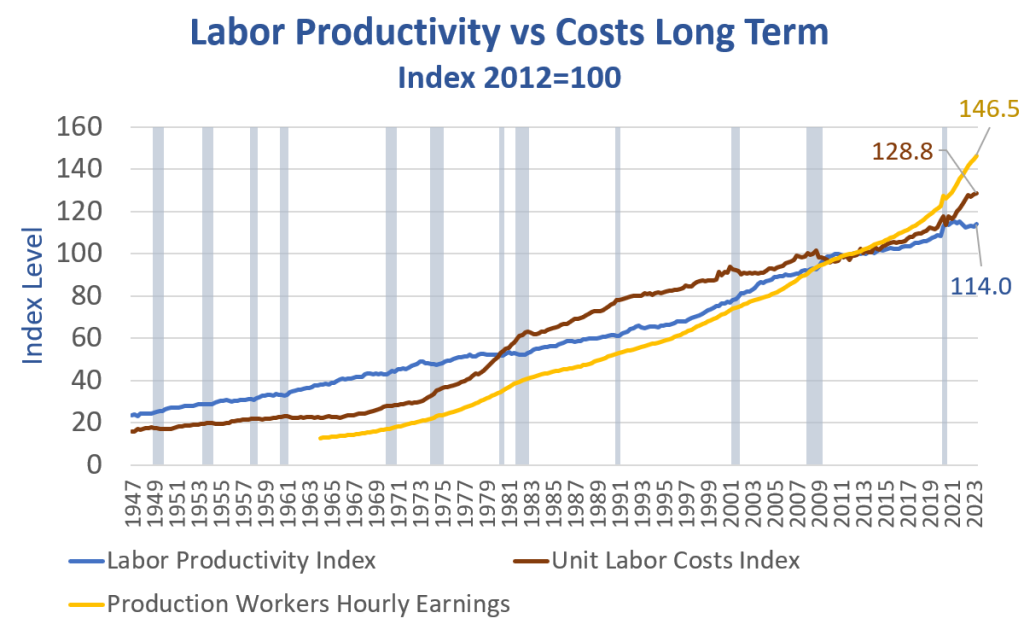
Despite the welcome jump in productivity, hourly earnings are still on a rampage vs productivity.
Index of Hours Worked Since 1947

In 100 percent of recessions since 1947, the index of hours worked has turned down.
Index of Hours Worked Since 1999

“The decline in hours worked is the first decline since the second quarter of 2020 and was the result of a 1.3-percent decline in average weekly hours; employment was unchanged. “
What Do Federal Tax Receipts and Total Receipts Suggest About Recession?

In case you missed it, please see What Do Federal Tax Receipts and Total Receipts Suggest About Recession?
The above chart is through 2023 Q1. Tax data for the second quarter is not yet available. See the above link for details.
More By This Author:
ISM Services Index Slips A Bit In July But Is Still Expanding
What Do Federal Tax Receipts And Total Receipts Suggest About Recession?
America’s Fiscal Time Bomb And The Fitch Downgrade Of US Debt In Pictures


Comments
Log in or sign up to join the conversation.