
“Everybody who reads the newspaper knows that the United States has a very serious long-term fiscal problem,” said Fitch in its downgrade of US debt.
(Click on image to enlarge)
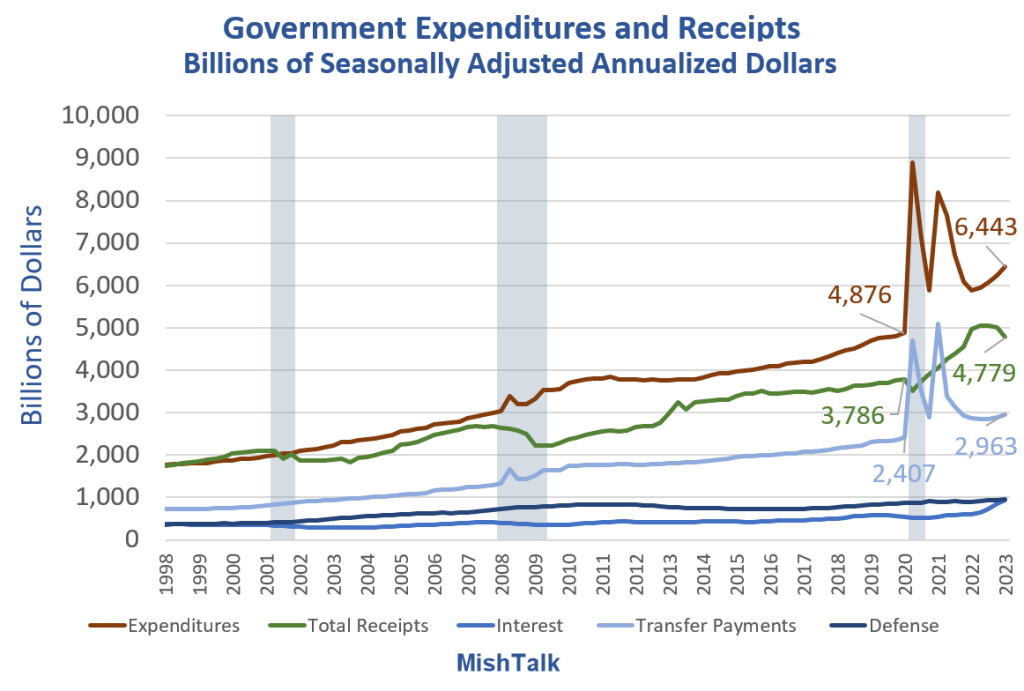
Government expenditures and receipts through 2023 Q1 from the BEA, chart by Mish
Government Expenditures and Receipts Notes
- The Bureau of Economic Analysis (BEA) numbers are incomplete for the second quarters so these numbers are through 2023 Q1.
- Expenditures are $6.443 trillion while receipts total only $4.779 trillion. That’s a gap of $1.664 trillion.
- Transfer payments include Social Security, Medicare, Medicaid, and Food Stamps. The latter is now called Supplemental Nutrition Assistance Program (SNAP).
- Mandatory government spending includes Social Security, Medicare, and Interest on the national debt. Interest at $929 billion now nearly equals defense spending at $959 billion. The latter is understated because it does not include homeland security and other expenses that are really defense related.
Expenditures and Mandatory Expenditures vs Receipts

Government expenditures and receipts through 2023 Q1 from the BEA, chart by Mish
Mandatory Spending Chart Notes
- The yellow line represents mandatory spending plus defense spending.
- Total receipts are $4.779 trillion.
- Mandatory spending plus military spending is $4.851 trillion.
Liars and Hypocrites Everywhere
Neither party is willing to cut Social Security. And recent vote on the defense budget shows that by an 88-11 margin, neither party is willing to cut defense spending either.
To eliminate the deficit while maintaining mandatory and defense spending, Congress would have to eliminate all other spending.
Of course, that’s not going to happen despite constant Republican chatter of reducing the deficit and balancing the budget.
Beyond Ridiculous Tweet
Government Expenditures Minus Receipts
(Click on image to enlarge)

Government Expenditures Minus Receipts, chart by Mish
There was no surplus in 1999 or 2000. Proof can be found by looking at national debt which rises more than the alleged deficit every year. This happens because the BEA does not count Social Security as a deficit as if here really is a trust fund when the money is really spent.
US Debt Clock 2023-08-02
(Click on image to enlarge)

The above image is from the US Debt Clock.
If you have not visited that site, I suggest you do. The chart is interactive and updates automatically every second.
Note that total US debt is now approaching $33 trillion and was “only” $21 trillion when Trump announced he would use tariffs to pay down the national debt. Did anyone really believe that?
Senate Votes to Throw $886 Billion at Defense. How Much Money is Wasted?
Yesterday, I noted that by an 88-11 margin the Senate Votes to Throw $886 Billion at Defense.
For a look at how much is wasted, please check out my report.
As Fitch says, “Everybody who reads the newspaper knows that the United States has a very serious long-term fiscal problem.” But what are we going to do about it?
Curiously, as a side note, the debt downgrade was realistically unwarranted. Debt downgrades pertain to risk of default. That specifically means, not paying interest. It does not at all factor in inflation or a sinking value of fiat currencies.
Since the US is no more likely to default in the required sense, the downgrade was unwarranted even though the Fitch comment was totally accurate. The US has a major problem.
More By This Author:
Manufacturing ISM Declines 9 Straight Months, New Orders Down 11 MonthsLooking For Deflation? Cast Your Eyes On China, Not The US
Is It Time to Bet on an Inflation Overshoot?


Comments
Log in or sign up to join the conversation.