
From today’s release:

Figure 1: Month on month annualized headline CPI inflation (blue), Bloomberg consensus of 8/9/2022 (blue square) and year on year inflation (pink), and Bloomberg consensus (red triangle). NBER defined peak-to-trough recession dates shaded gray. Source: BLS, Bloomberg, and NBER.
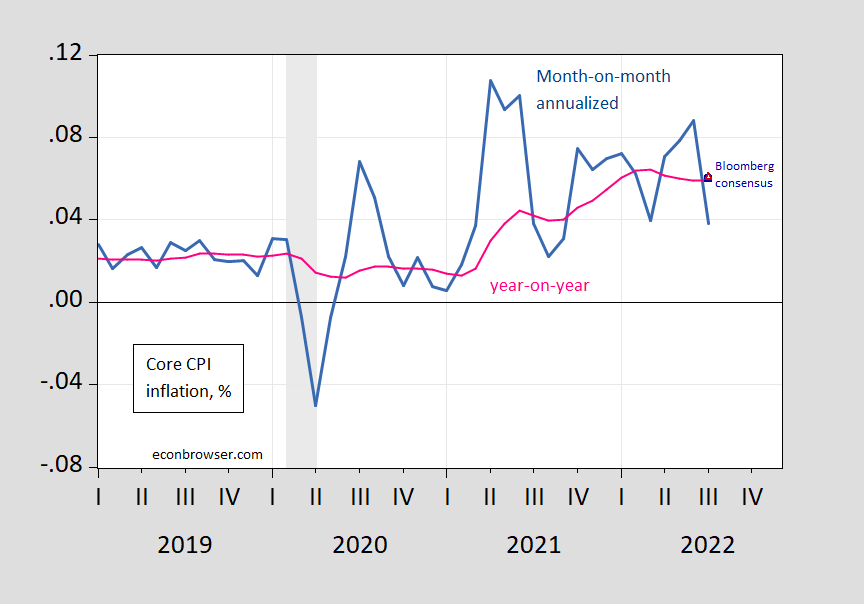
Figure 2: Month on month annualized core CPI inflation (blue), Bloomberg consensus (blue square) and year on year inflation (pink), and Bloomberg consensus (red triangle). NBER defined peak-to-trough recession dates shaded gray. Source: BLS, Bloomberg, and NBER.
The realized values of inflation — both core and headline — were below the Cleveland Fed’s nowcasts.

Source: Cleveland Fed, accessed 8/10/2022.
Bloomberg notes the drop in headline driven by gasoline. More discussion at CEA.
More By This Author:
One Year Ahead Inflation Expectations For July (And Forward 2-3 Year) DropInflation Expectations vs. Fed Inflation Target: Now Not That Far Off (If It Ever Was)
NFP Growth Of Over 500K In Historical Perspective


Comments
Log in or sign up to join the conversation.