Is The Stock Market Ready To Plunge? The Warning Signs Are Here
Watch the video extracted from the WLGC session before the market open on 20 Feb 2024 below to find out the following:
-
How to spot the exhaustion of demand.
-
The bearish analogue you could refer to to anticipate the down move.
-
The key level S&P 500 needs to break to trigger a selloff.
-
and a lot more...
Video Length: 00:07:55
I've already covered the things you will need to be aware of in my market update in 30s email on Monday, the details of how to derive a directional bias based on interpreting the price and volume are illustrated in the video above.
Market Environment
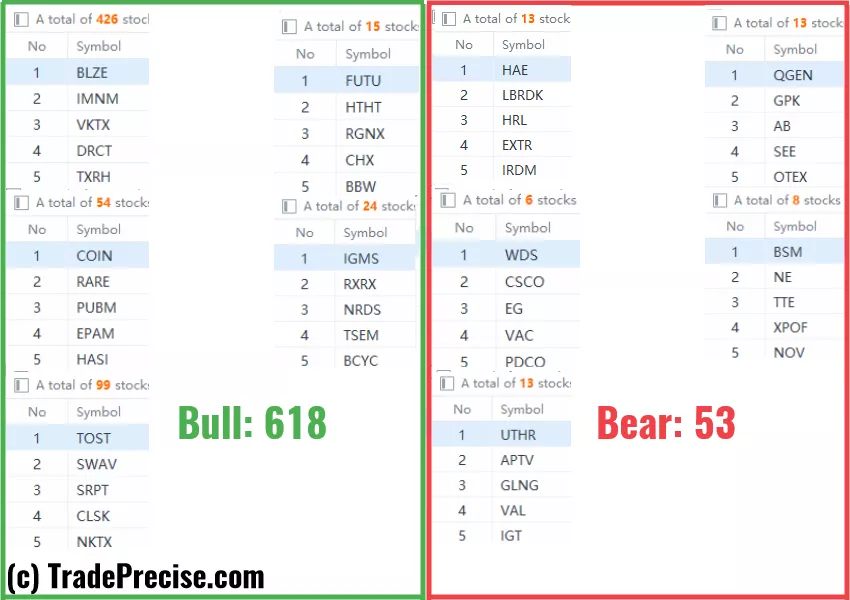
The bullish vs. bearish setup is 618 to 53 from the screenshot of my stock screener below.
(Click on image to enlarge)

The short-term market breadth is still showing bearish divergence, which is another bearish condition to watch out for.
During a market pullback, we can easily identify the true market leaders. So pay attention to the stock setups that show relative strength because they will be the candidates to turn up first (compared to the indices).
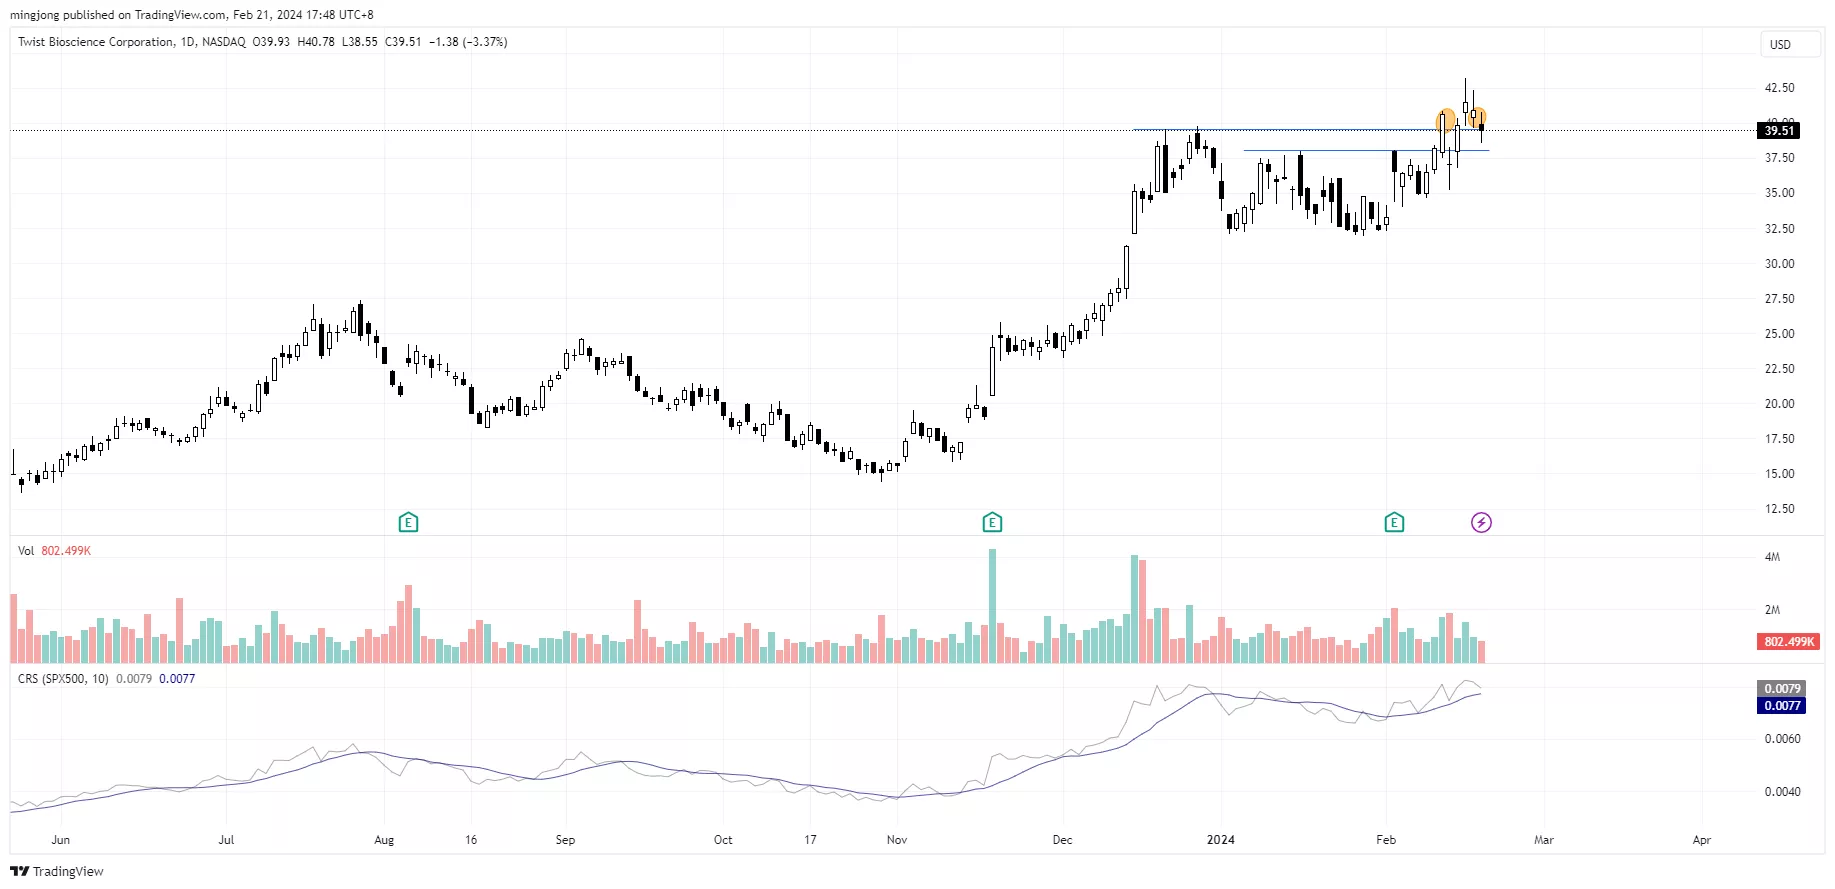
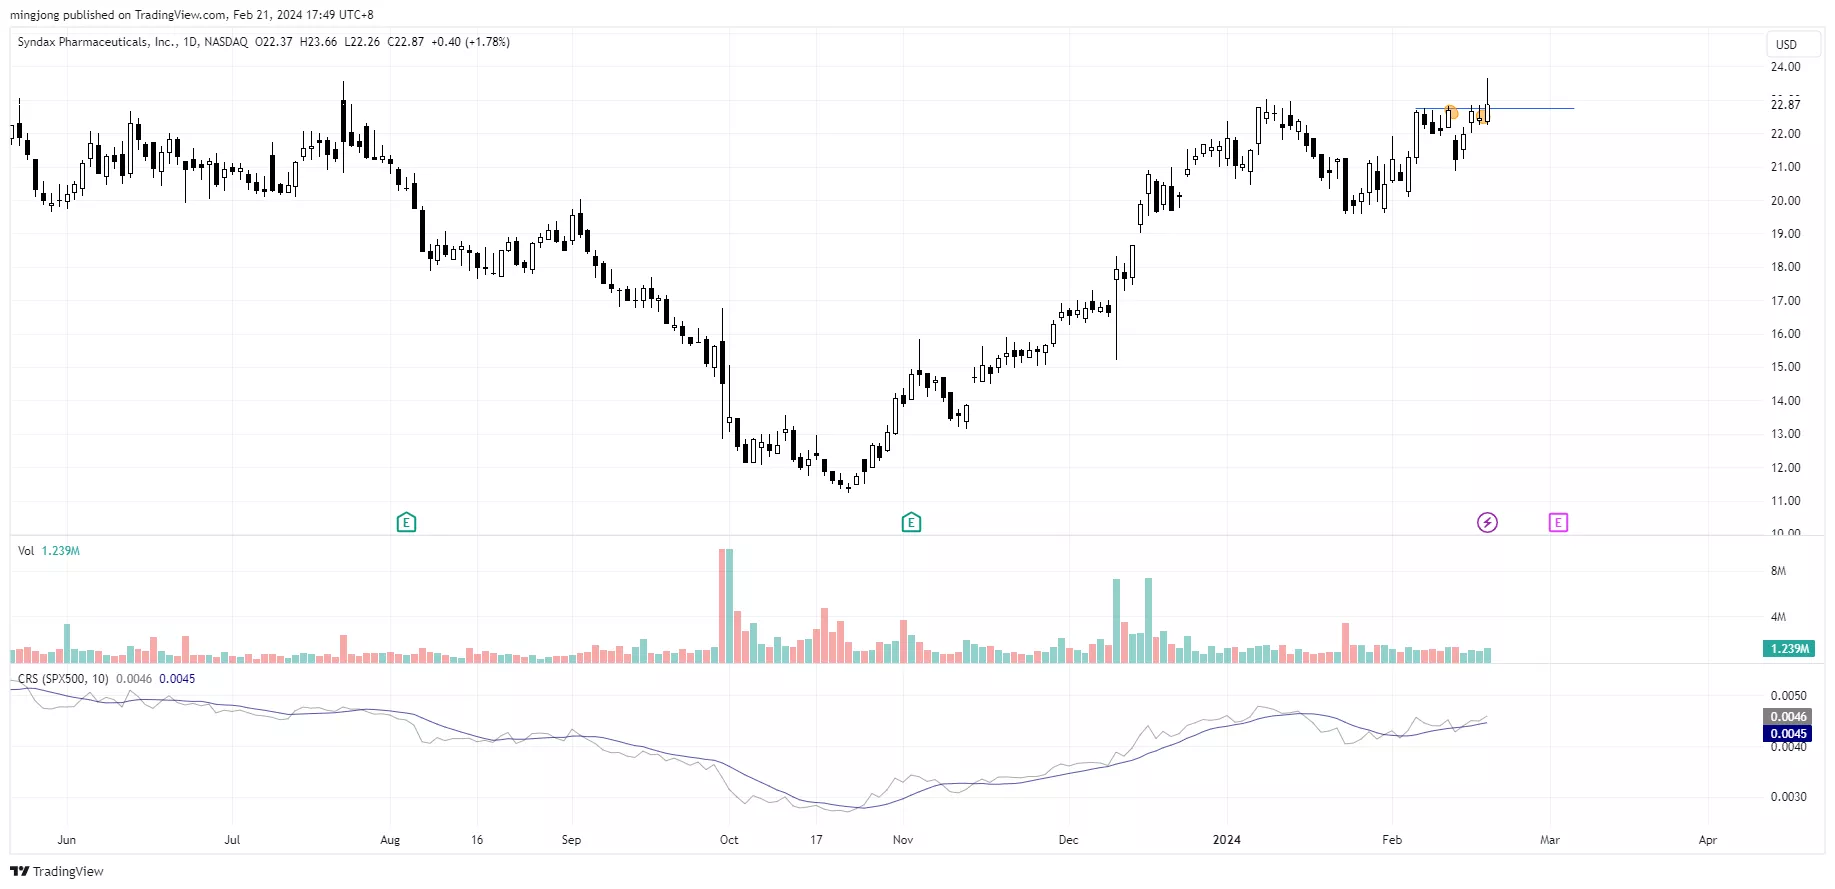
8 “low-hanging fruits” (TWST, INBX, etc…) trade entries setup + 16 actionable setups (SNDX etc…) plus 13 “wait and hold” candidates have been discussed during the live session before the market open (BMO).
(Click on image to enlarge)

(Click on image to enlarge)

More By This Author:
Overbought, Overextended - What's The Buzz In S&P 500 Now?
Decoding Bearish Analog And The Warning Signs You Can't Ignore
How Russell 2000’s Rise Signals Opportunities Beyond S&P 500?
Disclaimer: The information in this presentation is solely for educational purpose and should not be taken as investment advice.


