
That is the proposition forwarded by Kevin Drum at Jabberwocking. Verbatim:
So: have we really created 2.5 million new jobs since March? I’m not sure I believe that.
The graph he posted summarizes his argument succinctly:
(Click on image to enlarge)
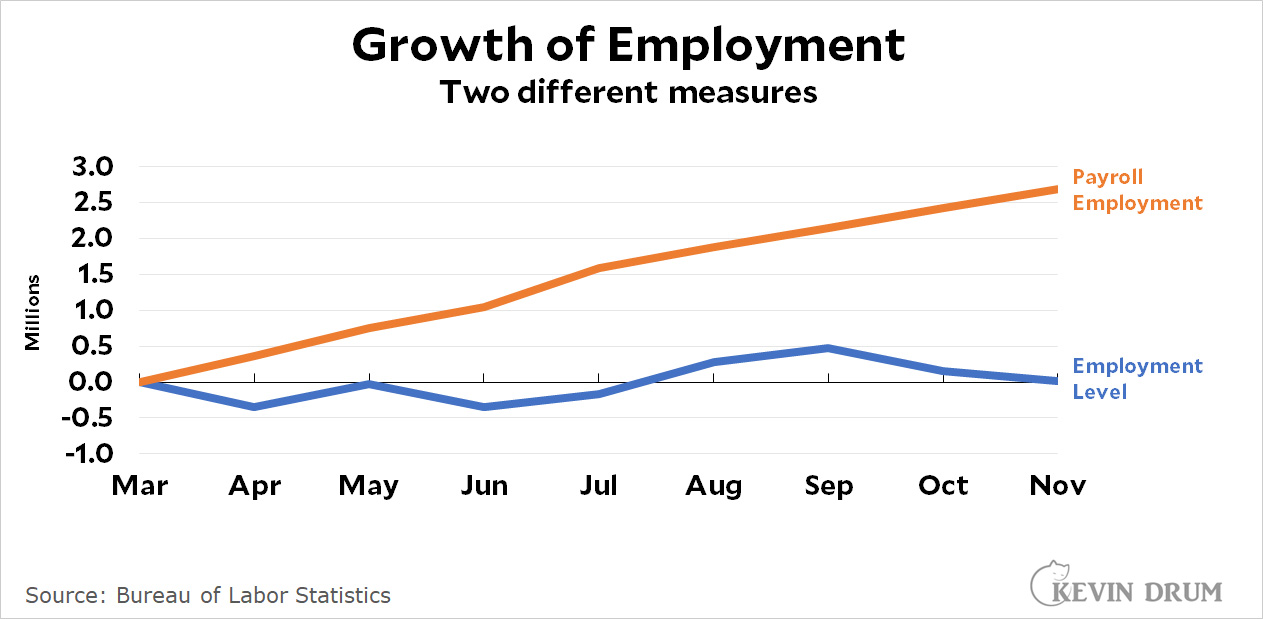
Source: Drum (2022).
The stylized fact is that the household series adds almost nothing to the information contained in the establishment series regarding the cyclical behavior or employment, a point made by practictioners (see Furman, 2016, or CEA, 2017). However, the possibility of mismeasurement, particularly in these times, remains. Some suggestion of mismeasurement is provided by the behavior of not-seasonally-adjusted nonfarm payroll (NFP) employment, and total employment covered by the Quarterly Census of Employment and Wages (QCEW). For a variety of reasons relating to employees coverage, the numbers vary, but the overall trends should provide some insight.
(Click on image to enlarge)
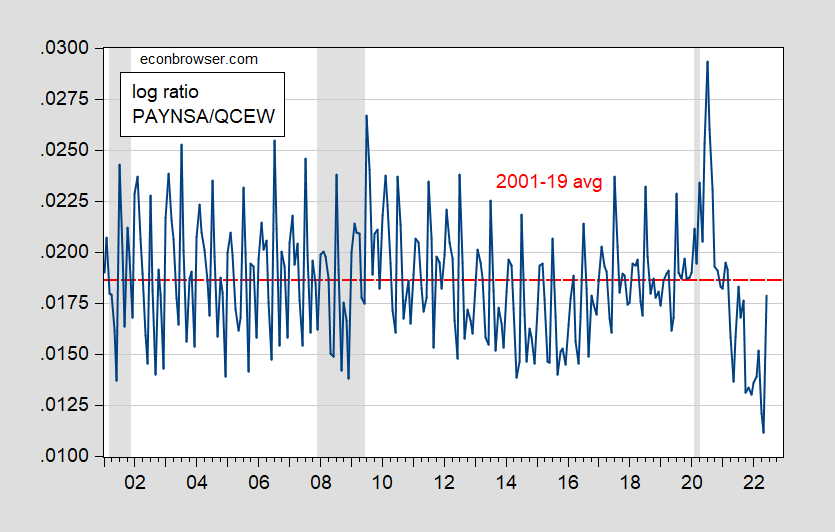
Figure 1: Log ratio of nsa NFP to QCEW (blue), and 2001-19 average (red dashed line). NBER defined peak-to-trough recession dates shaded gray. Source: BLS via FRED, BLS, NBER, and author’s calculations.
In 2021 and the first half of 2022, NFP has been below what the historical relationship with QCEW would suggest.
While the establishment survey is exactly that — a survey –, the QCEW is a census which should in principle catch all covered employment, by way of tax records, etc. This data, among others, is used to benchmark the establishment series. The last preliminary benchmark applied to March 2022 (but not has yet been incorporated into the official series — I do this in this post). Notice that in Figure 2, the ratio dropped precipitously in early 2022, and jumped back up in June. This suggest to me that as of June, the nsa NFP series was not way off. Now, the QCEW lags considerably (data through June was published on November 22), so we can’t really use the QCEW to make judgments on data from July through November.
GIven this, what make of net employment growth — measured in different ways — since March 2022 (when the last benchmark month was)? In addition to the official BLS establishment NFP series, the QCEW series (seasonally adjusted by me) and the household series adjusted to the NFP concept are shown in Figure 2.
(Click on image to enlarge)
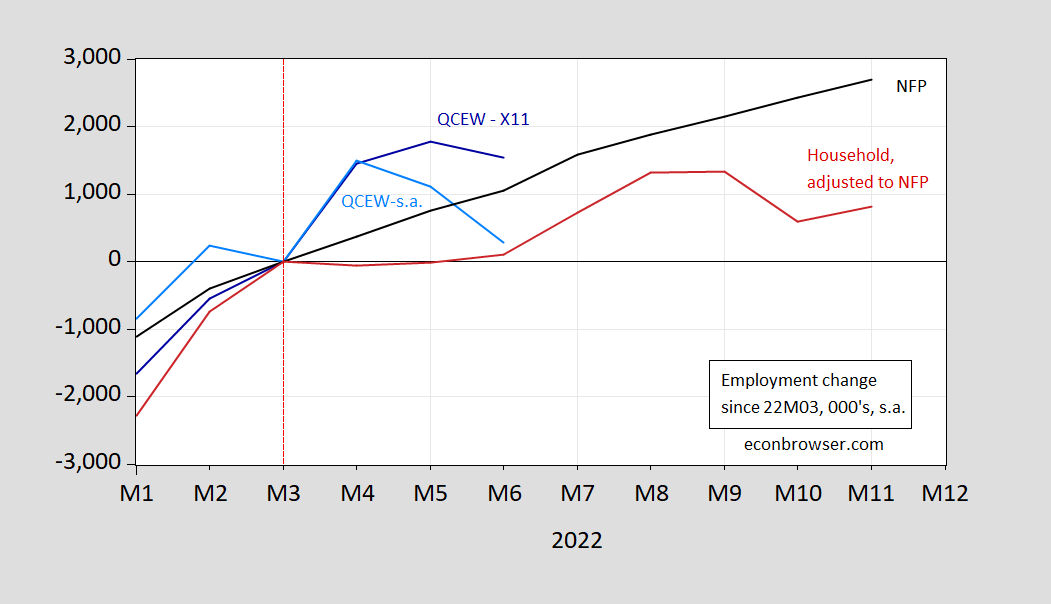
Figure 2: Change in employment from NFP (black), QCEW adjusted using Census X-11 seasonal adjustment by author (dark blue), QCEW using multiplicative moving average differences by author (sky blue), and using household employment series adjusted to NFP concept (red), all in 1000’s, relative to 2022M03. Source: BLS via FRED, BLS, BLS, and author’s calculations.
The research series on household employment adjusted to NFP concept is not an official series and is described here. A caveat: given that the household employment series is based on a relatively small sample, the variability associated with it — and hence by extension its derivative series — is going to be relatively large.
Through June, it’s unclear whether NFP undercounts or overcounts relative to the QCEW number given the differing results provided by the seasonal adjustment process. The adjusted household series indicates that through November, only about 800 thousand NFP jobs were created vs. 2700 thousand from the official NFP series.
One way to get around the seasonal adjustment problems (which have been compounded by the extreme drop associated with the pandemic) is to look at 12-month changes. This obviously downweights recent developments, but at least we get a look at the trends.
(Click on image to enlarge)
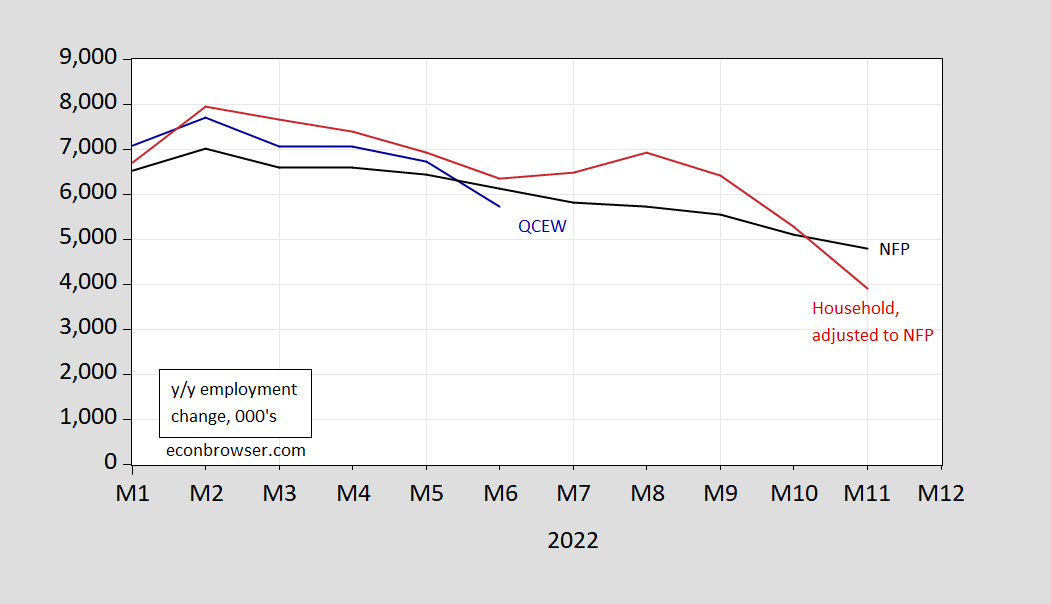
Figure 3: 12 month change in employment from not seasonally adjusted NFP (black), QCEW(dark blue), and household employment series adjusted to NFP concept (red), all in 1000’s, relative to 2022M03. Source: BLS via FRED, BLS, BLS, and author’s calculations.
All three series match up pretty well through 2022M06. Reading up to 2022M11, both the NFP and adjusted household series show declines. Which one to believe? As noted earlier, Furman, 2016 and CEA, 2017 place almost total weight on the establishment series. A more formal analysis showing almost total weight on initial establishment series for real time analysis is provided by Goto, Jacobs, Sinclair and van Norder (2021). (As an aside, if I look at the final data for NFP and the adjusted household series, statistically the adjusted household series seems to respond to gaps between the two series, while the NFP series does not; formally, the adjusted series responds to an error correction term.)
So, for now, while I see it as an open question what (NFP) employment growth is, I think (1) it is likely positive, and (2) likely declining in pace.
Addendum:
Macroduck suggests evaluating private NFP using ADP data. I repeat the above analysis, substituting ADP series for the household series.
(Click on image to enlarge)
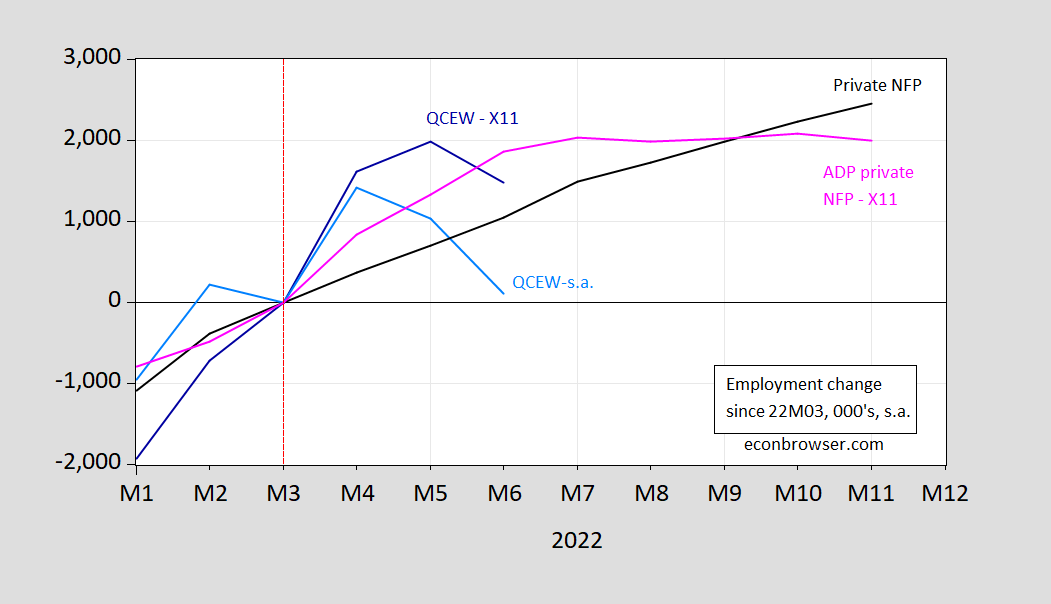
Figure 3: Change in private employment from NFP (black), private QCEW adjusted using Census X-11 seasonal adjustment by author (dark blue), private QCEW using multiplicative moving average differences by author (sky blue), and ADP private NFP (pink), all in 1000’s, relative to 2022M03. Source: BLS via FRED, BLS, BLS, and author’s calculations.
(Click on image to enlarge)
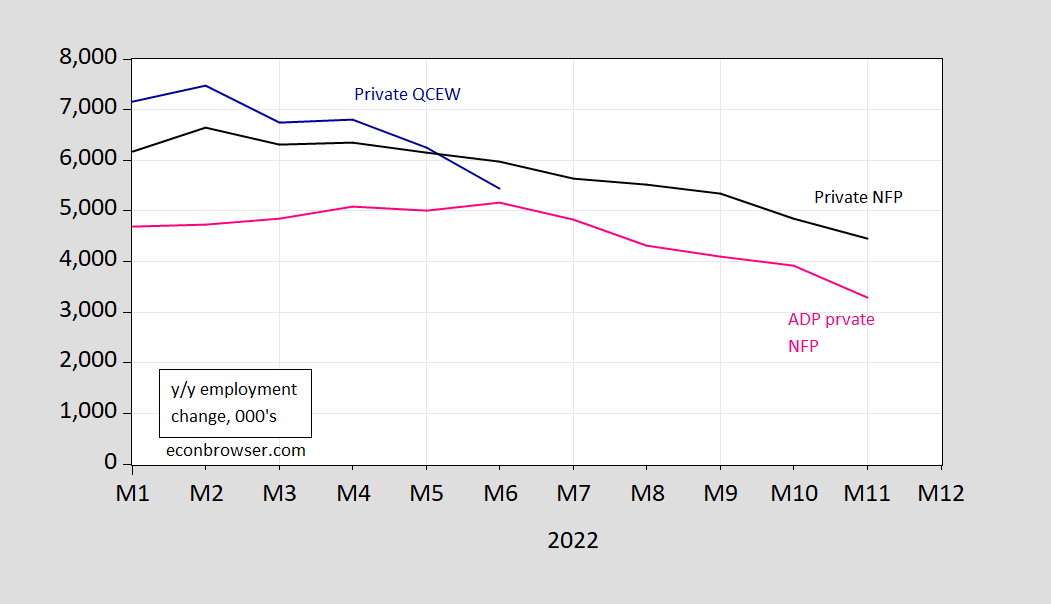
Figure 3: 12 month change in employment from not seasonally adjusted NFP (black), QCEW(dark blue), and household employment series adjusted to NFP concept (red), all in 1000’s, relative to 2022M03. Source: BLS via FRED, BLS, BLS, and author’s calculations.
The ADP series and the BLS CES series match pretty well, with the ADP series showing a faster deceleration. ADP shows about 2 million new private sector jobs vs. 2.45 for the BLS series.
More By This Author:
Employment Release And Business Cycle Indicators - Friday, Dec. 2Month-On-Month Inflation Seems To Have Peaked
Business Cycle Indicators At The Beginning Of December 2022


Comments
Log in or sign up to join the conversation.