“Is The Boom-And-Bust Business Cycle Dead?”
That’s a leading question in the NYT a little while back (just getting to this now that I’ve finished grading).
America’s contemporary economy, Mr. Rieder argued in his note to clients, is less vulnerable to the boom-and-bust cycles of old — mainly because its prosperous consumers are service-oriented, less dependent than ever on factories or farms. Consumption spending makes up about 70 percent of the economy.
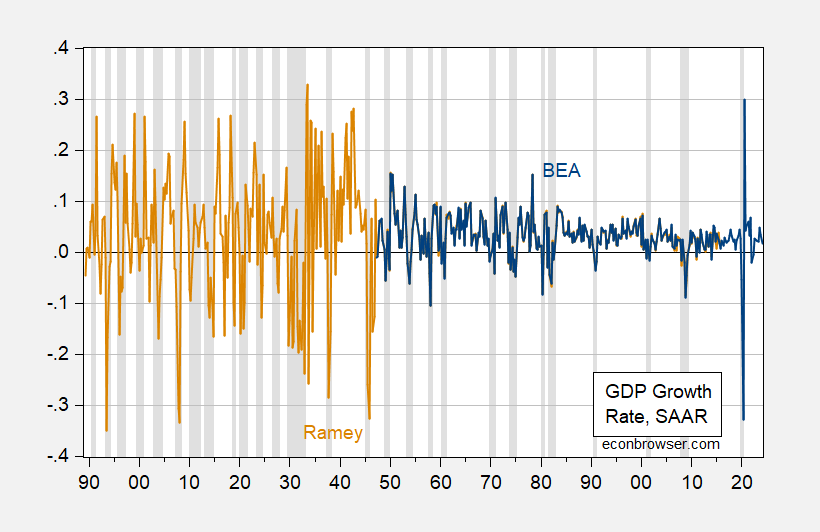
In one sense, it’s indisputable that the business cycle is less pronounced if one looks to the time series properties of real GDP.

Figure 1: Quarter-on-Quarter annualized GDP growth rate from BEA (blue), from Ramey (tan), calculated in log differences. NBER defined peak-to-trough recession dates shaded gray. Source: BEA, Ramey, NBER and author’s calculations.
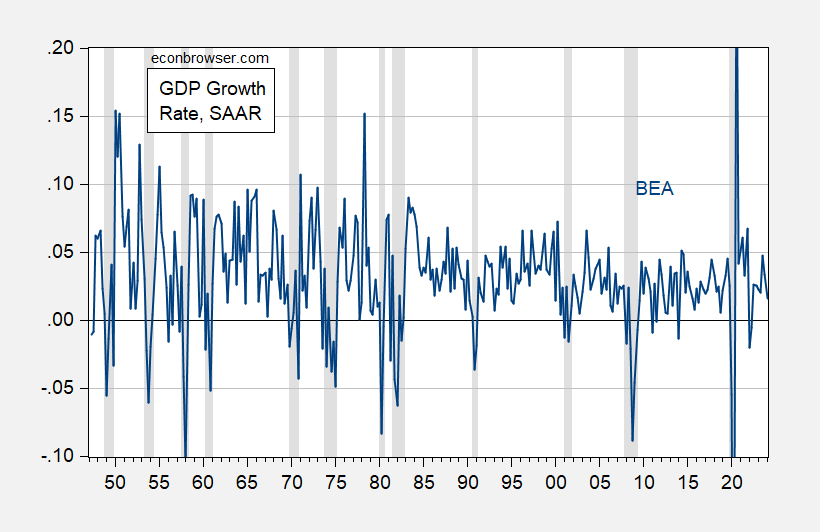
Even for the sample compiled by BEA, one has the following picture of generally declining volatility in GDP.

Figure 2: Quarter-on-Quarter annualized GDP growth rate from BEA (blue), calculated in log differences. NBER defined peak-to-trough recession dates shaded gray. Source: BEA, NBER and author’s calculations.
Aside from the pandemic-related recession, GDP volatility has been much smaller. The length of expansions as determined by NBER has also increased. This change has been apparent for a long time, and prompted Bernanke’s coining of the term “the Great Moderation”.
The discussion reminds me of the talk around the turn of this century about how new information technologies would allow for enhanced inventory management (Economic Report of the President, 2001):
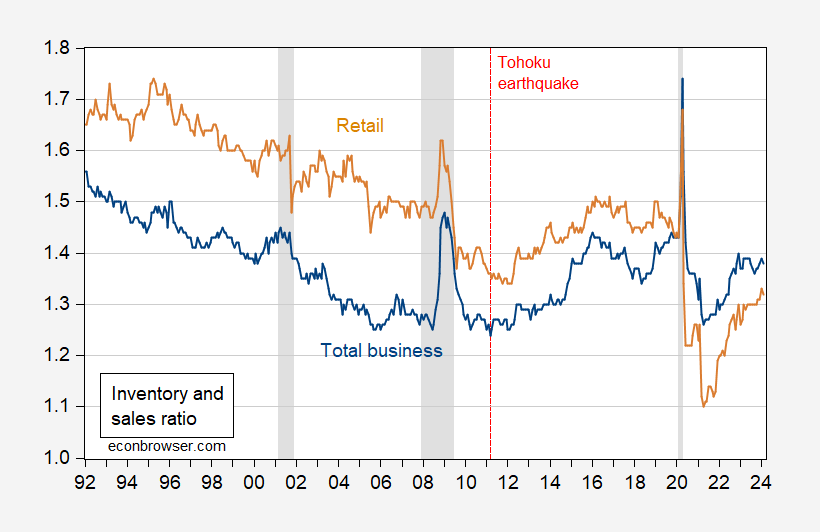
I don’t have access to the same series, but here are inventory-sales ratio for total business and for retail, with sample extending to 2023Q4.

Figure 3: Inventory-to-sales ratio for total business (blue), for retail (tan). NBER defined peak-to-trough recession dates shaded gray. Source: Census via FRED.
Inventory ratios continue to shrink after 2000, until 2008 when interrupted by the Great Recession. They start to rise again after the Tohoku earthquake in Japan, which highlighted the hazards of far flung supply chains.
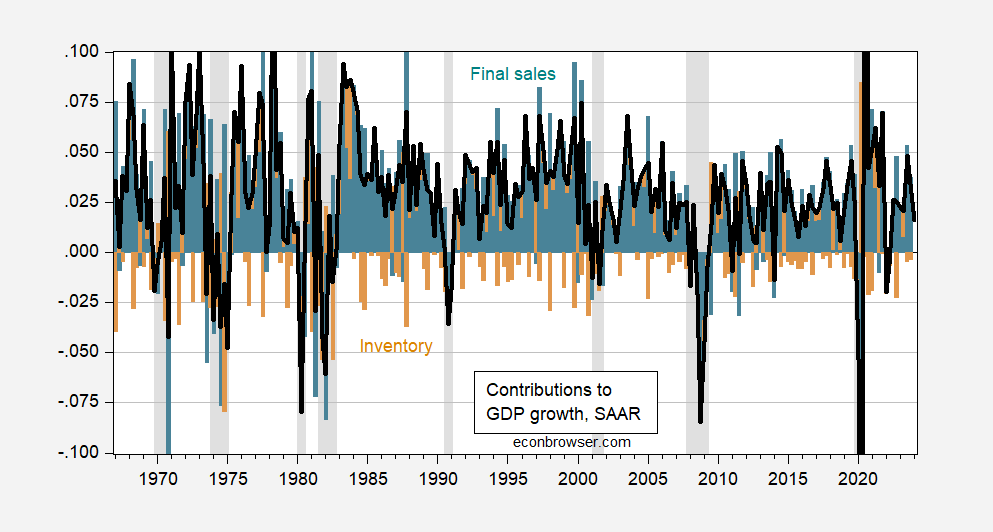
What does seem true is that the relative contribution of inventory changes to overall GDP growth has declined over time.

Figure 4: GDP q/q annualized growth rate (black line), contribution of final sales (teal bar), contribution of inventory changes (tan bar). NBER defined peak-to-trough recession dates shaded gray. Source: BEA.
So, to some extent, the story that we tell in intro macro about disequilibrium in the Keynesian cross being eliminated by inventory decumulation or accumulation via production changes is less relevant than in the past. Whether that remains true depends on the extent of re-shoring, or friendshoring, as countries and firms attempt to shock-proof supply chains.
As noted in the NYT article, however, other shocks — demand and supply — remain, including financial crises (2007-09), debt crises (2009-12) or pandemics (2020). For me, the business cycle remains, even as some propagation modes might have become less relevant.
More By This Author:
Hi Ho, Hi Ho, It’s Off To FX War We Go!“You Have To Look Pretty Hard To Find The 'Trade War' Effect In The Data”
Manufacturing Malaise?


