
Is Interest In Uranium Stocks Waning?
(Click on image to enlarge)
One of the questions I am often asked about volume price analysis is whether this approach can be applied to pink sheet stocks and the short answer is yes. After all, all that’s required is volume and price and we can then analyze the chart in the same way. A pink sheet stock may be more volatile particularly if the volume and liquidity are low but the principles remain the same.
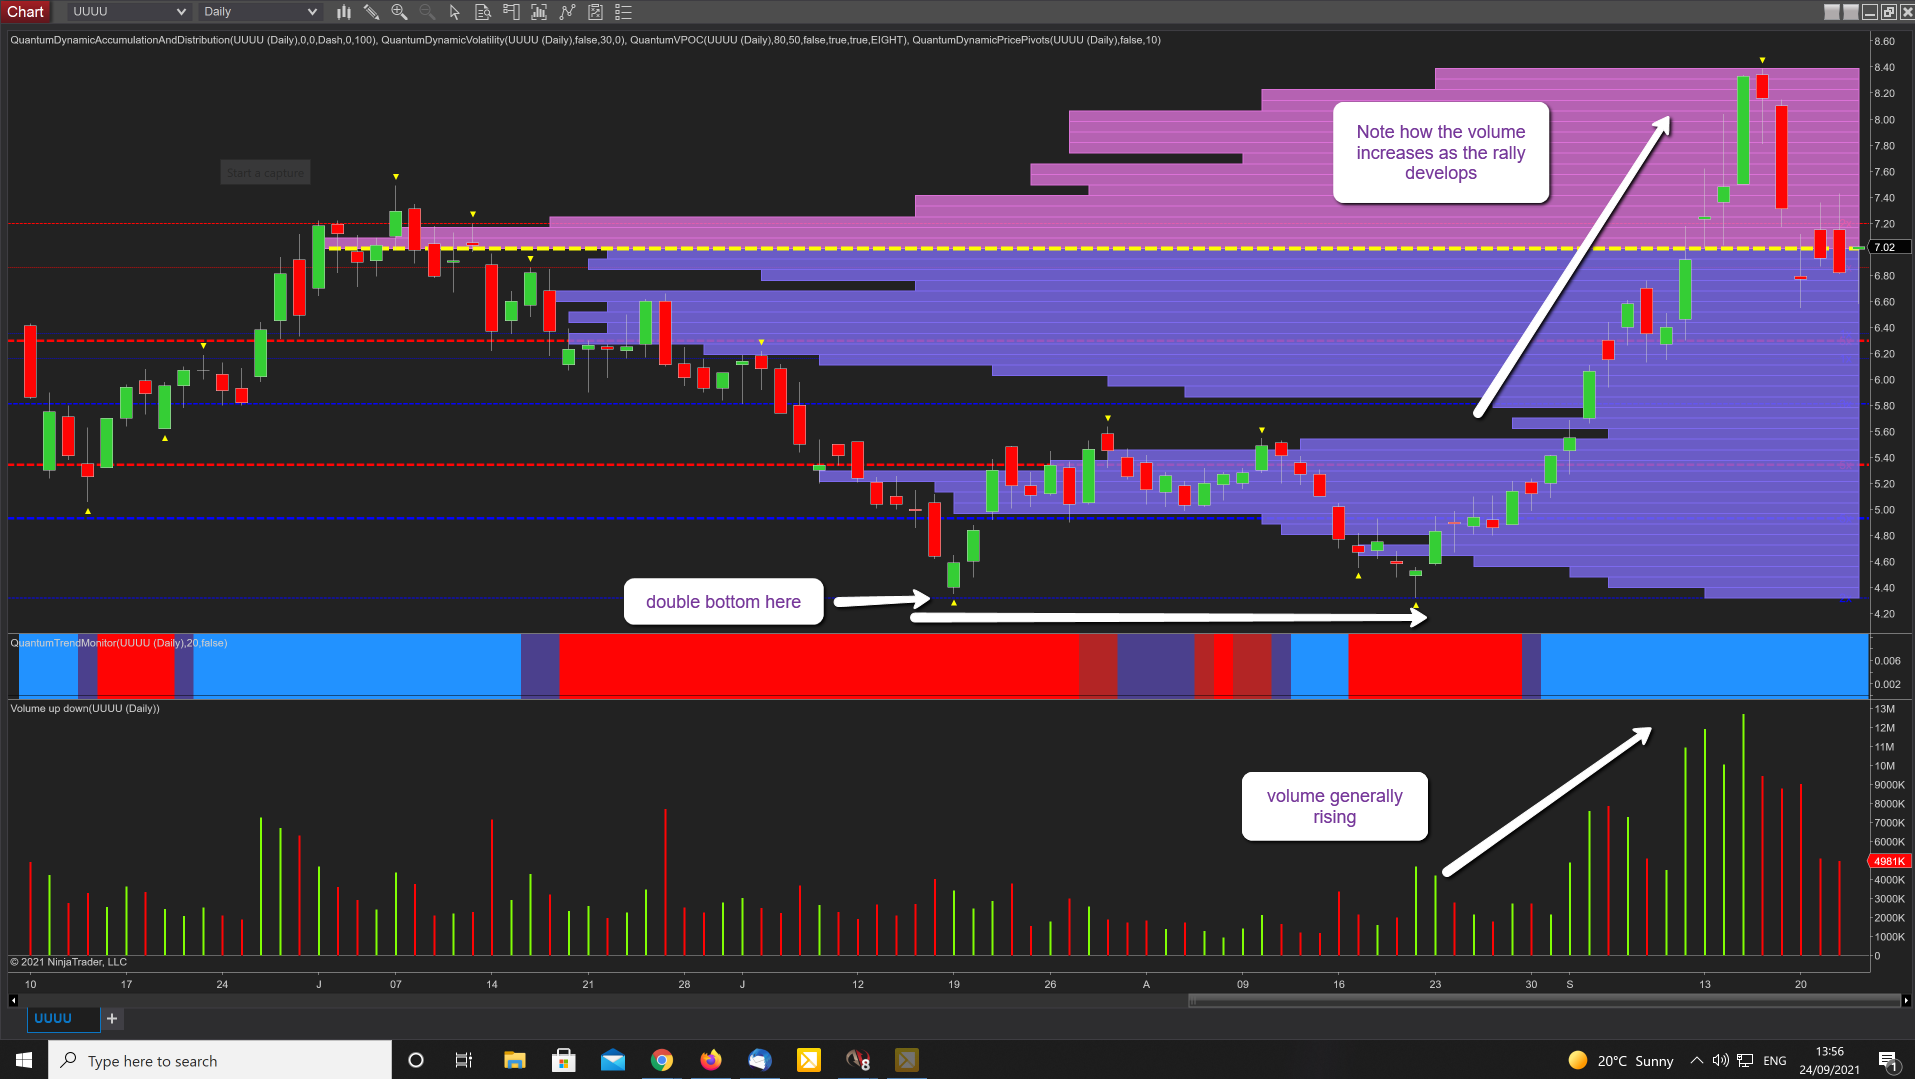
One such example is UUUU Energy Fuels, a uranium stock, and like many in this sector has seen an uptick in interest over the summer months, a fact which is confirmed on the chart when we consider the associated volume with the rally of late August and September. It was a rally founded on the double bottom at $4.40 and confirmed with the platform of support on the accumulation and distribution indicator and denoted with the blue dashed line. Once resistance at $5.80 had been breached and the price had progressed through the low volume node, the volume builds nicely as we advance towards the VPOC denoted with the yellow dashed line at $7.02 and then on towards $8.30. At such a point it’s always important to view the price action in the context of other timeframes and in this case, it would be weekly. Using multiple timeframes is, of course, a key concept of both vpa and classical technical analysis, and as we can see once we consider the weekly there is a clear signal of weakness with the shooting star validated by the highest volume on this timeframe confirming the rally had come to an end, at least for the time being, as the stock now looks set to return to $6 per share where the VPOC resides on this chart.
(Click on image to enlarge)
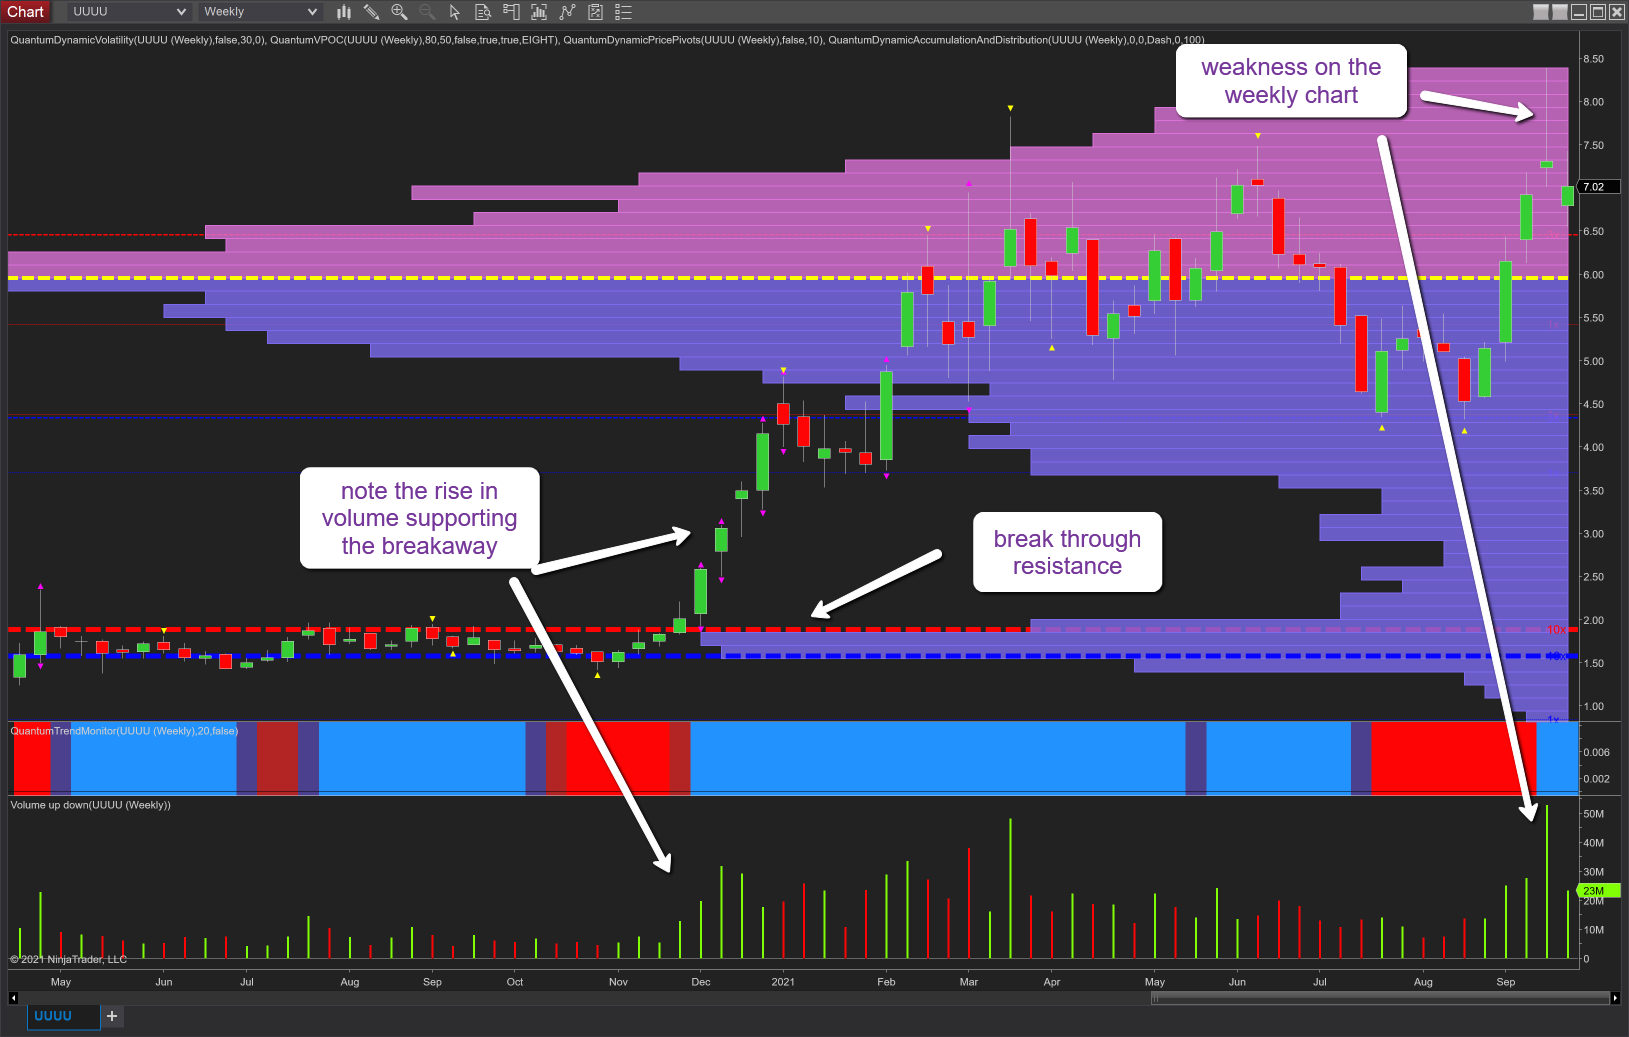
Rounding off on the theme of volume and its application to pink sheet stocks, note the crescendo in volume which occurred back in November 2020 as the breakaway rally developed from the $2 price range following a heavy phase of consolidation, breaching the strong resistance denoted with the red dashed line which then provided a solid platform of support for the move higher.
As mentioned in previous posts it is always a good idea to check the fundamental background and metrics for the stock and for this I always use Marketbeat.com and we have some interesting data points, the most noteworthy being the extent of short interest in this stock which stands at almost 9% of the float as of the 31st August, a slight reduction from earlier in the month but still significant. Whether this attracts the attention of what I like to call retail, activist traders for a short squeeze remains to be seen.
Finally, I selected this stock for one of our webinars as I wanted to cover some vpa lessons and chart patterns. The site I use for filtering is Finviz (again a free resource) using 2 simple search metrics. The first, stocks with an average volume of over 1m, and the 2nd stocks with a relative volume of over 1.5. David and I will be doing further stock trading and investing webinars where we will be expanding on the topic of filtering. All the webinars are recorded and can be found at my Youtube channel.
Disclaimer: Futures, stocks, and spot currency trading have large potential rewards, but also large potential risk. You must be aware of the risks and be willing to accept them in order to invest in ...
more

