Inflation Breakevens And Expected Inflation: 5, 10, 30 Year Horizons
Beware the risk and liquidity premia, when inferring inflation expectations from breakevens.

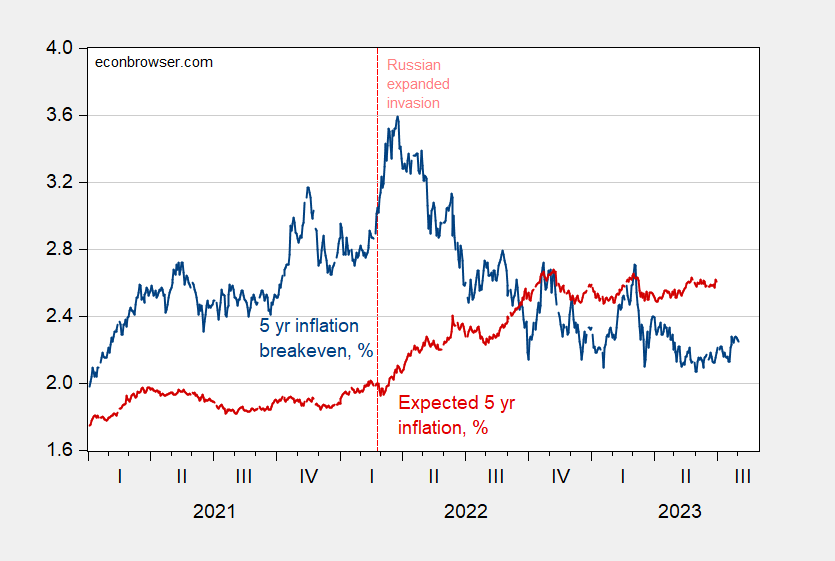
Figure 1: Five year inflation breakeven calculated as five year Treasury yield minus five year TIPS yield (blue), five year breakeven adjusted by inflation risk premium and liquidity premium per DKW (red, left scale), both in %. Source: Treasury via FRED, Treasury, KWW following D’amico, Kim and Wei (DKW) accessed 8/3/2023, and author’s calculations.

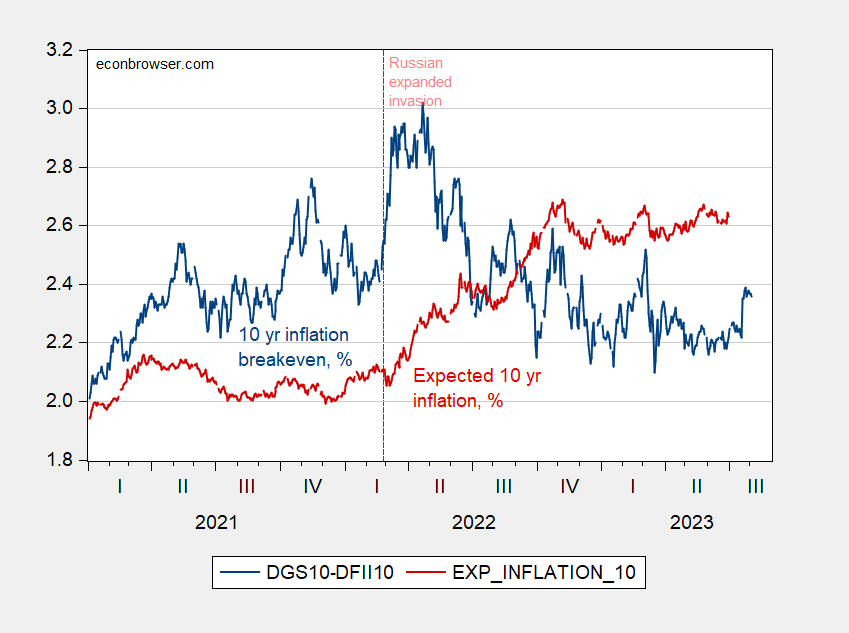
Figure 2: Ten year inflation breakeven calculated as ten year Treasury yield minus ten year TIPS yield (blue), ten year breakeven adjusted by inflation risk premium and liquidity premium per DKW (red, left scale), both in %. Source: Treasury via FRED, Treasury, KWW following D’amico, Kim and Wei (DKW) accessed 8/3/2023, and author’s calculations.

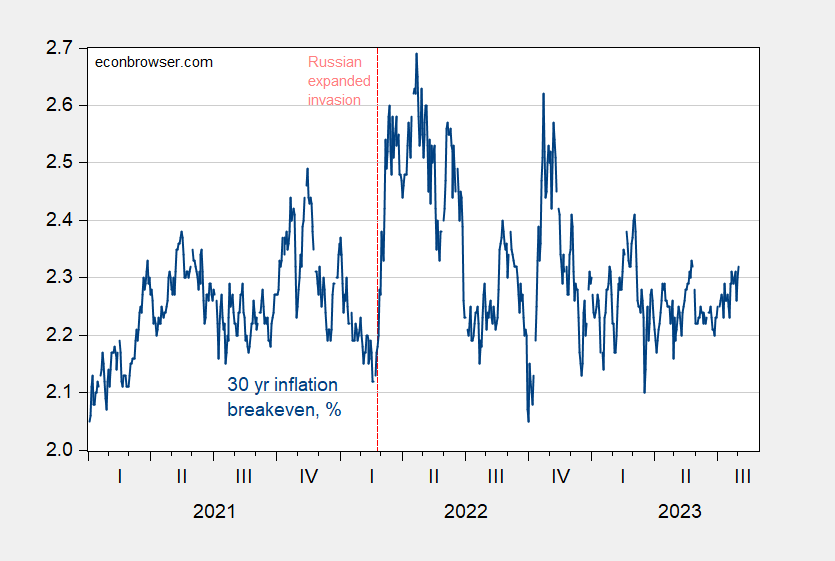
Figure 3: Thiry year inflation breakeven calculated as thirty year Treasury yield minus thirty year TIPS yield (blue), in %. Source: Treasury via FRED, Treasury, and author’s calculations.
While breakevens have decline since end-2022, estimated expected inflation has remained pretty high through end-June.
More By This Author:
Business Cycle Indicators, At The Beginning Of AugustThe Sensitivity Of Economic Sentiment To Partisan Affiliation
Defense Spending Over Time


