

Image source: Pixabay
The average stock that has reported earnings this week (more than 600 companies) has seen a one-day share price reaction of more than +/-8.5% (absolute change). That's much higher than the 20+ year average absolute move of 5.75% that US-traded stocks have historically experienced on their earnings reaction days. (What this means is that in modern markets, the average stock can expect to see a one-day move of +/-5.75% once per quarter following its earnings release. Yes, a large portion of a stock's move over its lifetime comes from the one trading day each quarter after it reports earnings.)
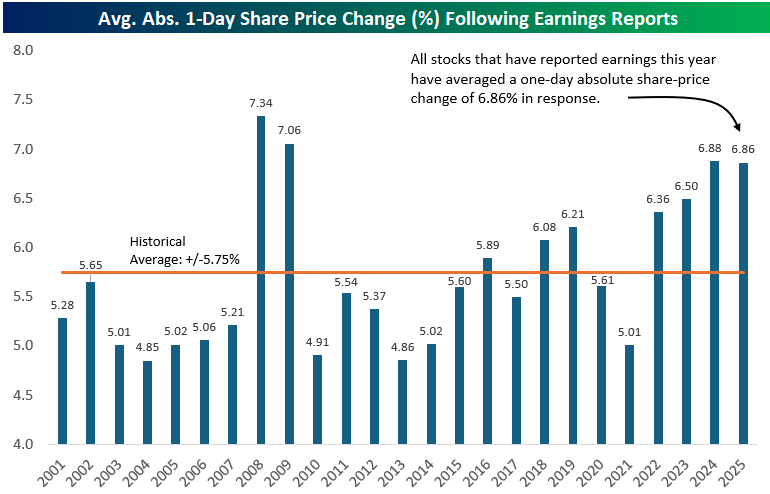
Notably, stocks have been getting more volatile on their earnings reaction days in recent years. Below is a chart showing the average one-day absolute percentage change that stocks saw in reaction to earnings by year going back to 2001 using our Earnings Explorer tool.
In the early 2000s before the Financial Crisis, investors could expect the average stock to move a little over +/-5% on its quarterly earnings reaction day. The average move on earnings then spiked to record levels above +/-7% during the Financial Crisis when overall market volatility increased dramatically and investors sold everything like their life depended on it for a couple of years.
From 2010 to 2015, things settled down again and the average stock once again moved about +/-5% on earnings. Since 2015, however, we've seen a general uptrend in earnings-day volatility for stocks. In 2018, the average move on earnings ticked back above +/-6% for the first time since the Financial Crisis. Aside from a random dip back down to 5% in 2021, daily vol on earnings has ticked higher and higher back up near 7% in 2024 and 2025. So far this year, the average stock that has reported has seen a one-day move of +/-6.86%.
(Click on image to enlarge)
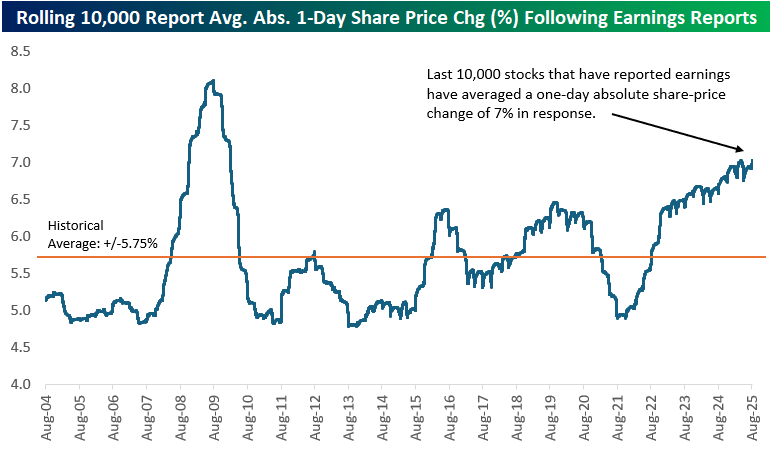
Another way to chart long-term earnings-day volatility is to look at the rolling 10,000-earnings report average one-day move for US stocks that have reported since 2001. Each point on the blue line in the chart below shows the average one-day change on earnings that the prior 10,000 stocks reporting have experienced.
Interestingly, the spike in earnings vol during the Financial Crisis came during a nasty bear market when equities were drawing down sharply for more than a year. The recent move higher has come during a period when US equities have been in an uptrend for multiple years.
In the current day and age of easy, commission-free trading on brokerage apps available right on your smartphone, share-price volatility in reaction to stock-specific earnings news has moved increasingly higher. At the same time, overall market volatility hasn't seen a similar increase, which means that more and more of a stock's overall performance is coming from the one trading day per quarter when it posts its financial results and forward guidance.
(Click on image to enlarge)
More By This Author:
Quitters Never WinBull-Bear Spread Tips Negative
Energy Sector Breaks; Gold Goes Sideways


Comments
Log in or sign up to join the conversation.