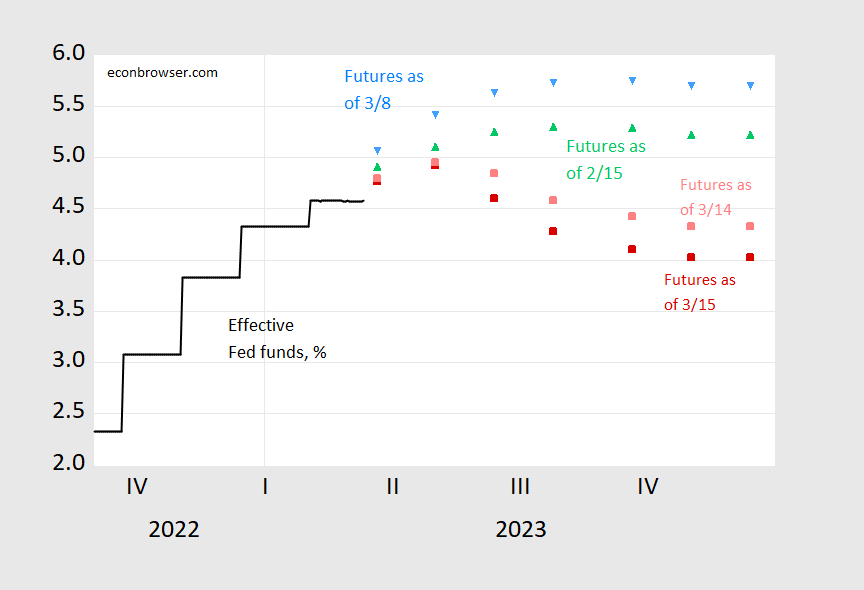
Implied Fed Funds Peak – From September To May
Using CME futures, from 1:30CT today:
(Click on image to enlarge)

Figure 1: Effective Fed funds (black), implied Fed funds as of March 15 1:30CT (red square), March 14 (pink square), March 8 (sky blue inverted triangle), and February 15 (green triangle). Source: Fed via FRED, CME Fedwatch, accessed 3/15 1:40PM CT, and author’s calculations.
Two pieces of news today – the first was regarding Credit Suisse, the second is macro news, where the PPI undershot, as did retail sales (slightly). My guess is that financial stress dominated.
It is interesting that the path was higher a week ago relative to a month ago, likely incorporating Chair Powell’s fairly hawkish comments regarding inflation persistence and consequent Fed policy. The downshift in the implied path of the Fed funds is all the more remarkable in that context.
More By This Author:
Month-On-Month Core PPI At 0%Spreads And Uncertainty/Risk Measures Post-SVB, Post-CPI Release
Inflation Surprise Barely Moves Expected Fed Funds Path


