HTD: A Solid Dividend CEF For Anyone Wanting To Grow Their Wealth And Generate Income
One of the most popular investing styles among retirement investors is dividend investing. This makes sense as retirees would benefit a great deal from generating their income in this way as opposed to being forced to sell their stocks in order to generate the income that they need to fund their retirements. The recent turbulence in the market has shown us just how important this can be as those that receive their income through dividends have not had to sell following the market declines. That would be a comforting though. Unfortunately though, the yield on the S&P 500 is a rather discouraging 2.03%. Thus, it would likely be appealing to invest in a much higher yielding portfolio of stocks. There are in fact a few ways to do this. One of the best funds in the area is the John Hancock Tax-Advantaged Dividend Income Fund (HTD), which will be the topic of the remainder of this article.
About The Fund
According to the fund’s web page, the John Hancock Tax-Advantaged Dividend Income Fund has the stated objective of delivering a high level of total return from dividend income and capital appreciation. This is not a particularly unique objective as most closed-end funds that invest primarily in equities have a similar one. The fund mostly invests in utilities to accomplish this goal, which is also not particularly unique as I have discussed numerous other utility-focused closed-end funds in the past. It is not particularly surprising that the fund is doing this as the utility sector does generally boast higher dividend yields than other market sectors. With that said though, this fund does not appear to be exclusively limited to utilities and can invest elsewhere. At the moment though, the fund’s management appears to believe that other sectors lack attractive dividend opportunities. Other than energy, I would agree with this conclusion.
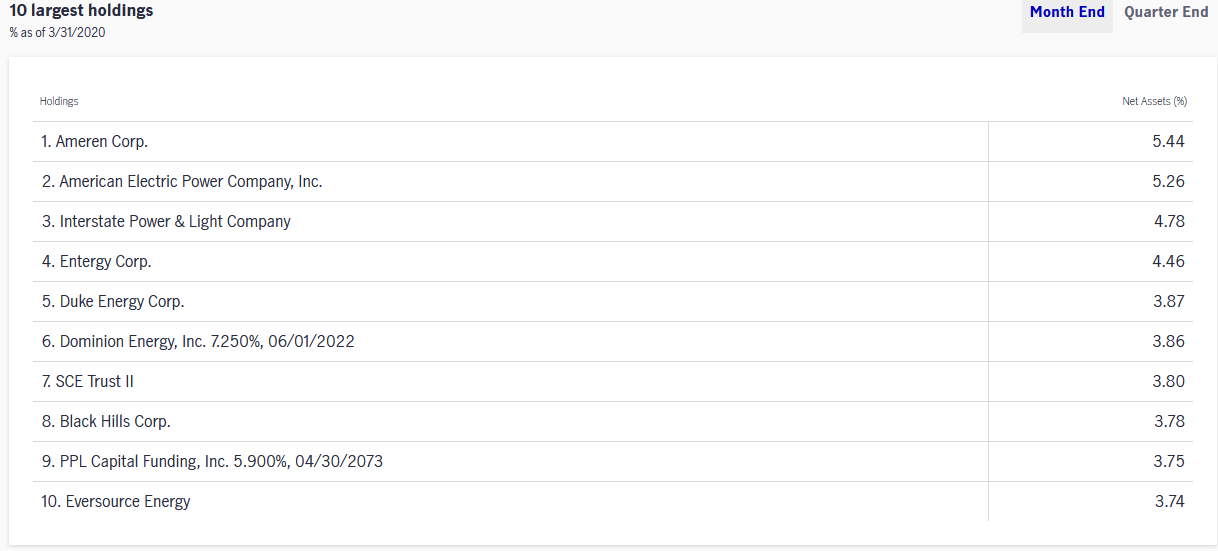
As just mentioned, at the moment, the fund is heavily invested in the utilities sector. We can clearly see this reflected in its largest holdings. Here they are:
(Click on image to enlarge)

Source: John Hancock Investment Management
As we can see here, all of the top ten holdings in the fund are utility companies. The utilities sector as a whole has some appealing characteristics in the current market environment. After all, it is not likely that people will allow their electricity or heat to be turned off even if the economy goes into a recession so they will continue to pay these bills and cut back on discretionary spending if incomes become constrained. This gives these companies relatively stable cash flow in all economic cycles allowing them to pay out reasonably safe dividends. In addition, growth opportunity for utilities can be somewhat limited as they are often monopolies confined to a single region. This allows them to pay out a higher percentage of their cash flow to investors in the form of dividends than similar companies focused exclusively on growth. These factors all combine to give them somewhat higher yields than the broader market.
As my regular readers on the topic of funds are likely well aware, I do not generally like to see any single position account for more than 5% of the fund’s total assets. This is because this is approximately the level at which a position begins to expose the portfolio to idiosyncratic risk. Idiosyncratic, or company-specific, risk is that risk which any financial asset possesses that is independent of the overall market. This is the risk that we aim to eliminate through diversification but if an asset is too heavily-weighted in the portfolio then this risk will not be completely diversified away. Thus, the concern here is that some event may occur that causes the price of a given asset to decline when the broader market does not. If that asset accounts for too much of the portfolio then such an event would drag the entire fund down with it. As we can see above though, there are only two positions in this fund that account for more than 5% of its total assets and neither one of them is much above that 5% threshold. Therefore, it does appear that HTD is reasonably well-diversified so we do not need to worry about this risk.
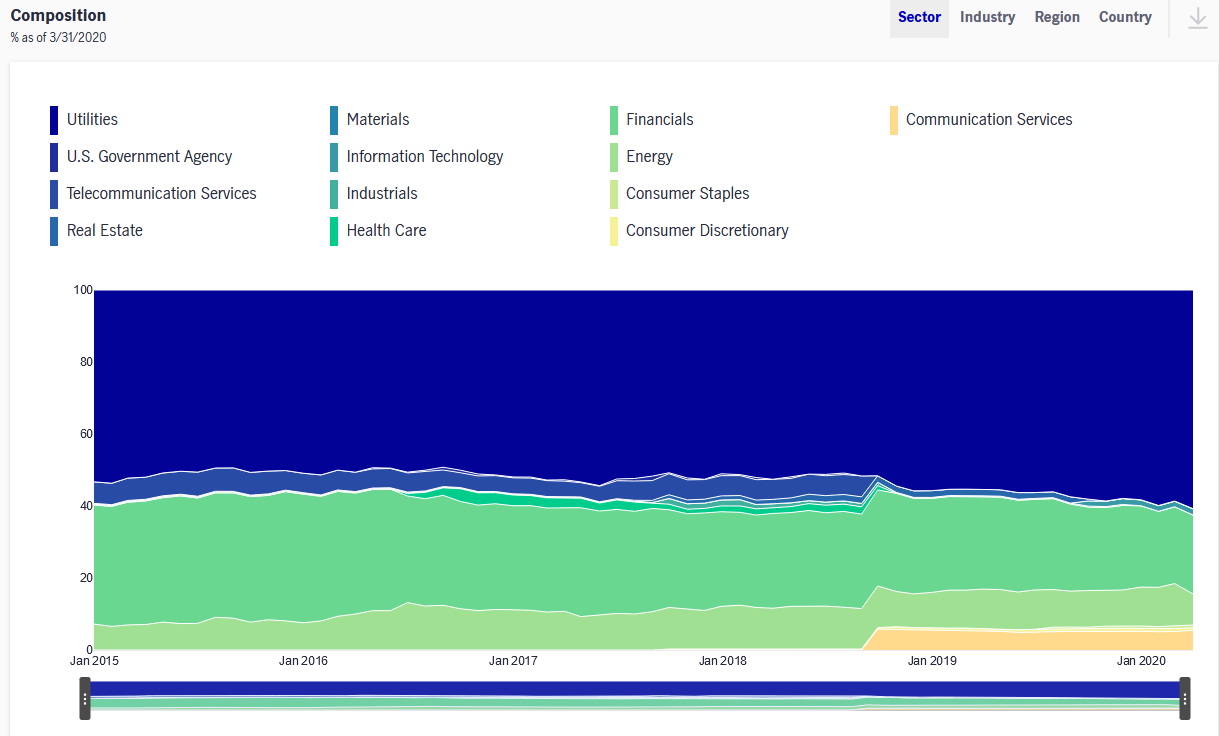
While the fund invests mostly in utility stocks, it is not exclusively limited to investing in that sector. In fact, utility currently account for 60.72% of the portfolio. This has been a relatively consistent weighting over the years. We can see that here:
(Click on image to enlarge)

Source: John Hancock Investment Management
The other two sectors that typically account for fairly large weightings in the portfolio are financials and energy. Currently, financials account for 21.97% of the portfolio and energy accounts for 8.61%. This is unlikely to be a surprise to anyone reading this as utilities, financials, and energy do boast some of the highest dividend yields in the market today. These sectors have also been beaten down more than some others in the current market volatility, which is particularly true in the case of energy, which has pushed yields up. Depending on when the fund bought in, this could position it to earn very nice capital gains when these sectors ultimately rebound. However, considering that it only has a 13% portfolio turnover, it seems likely that the fund rode some of these positions down and is sitting on some unrealized losses.
Leverage
As is the case with many closed-end funds, HTD employs the use of leverage to enhance its returns. The basic strategy is that the fund borrows money and then uses that borrowed money to buy dividend-paying stocks. As long as the yield on the purchased stocks is higher than the interest rate on the debt then this works to increase the effective income off of the portfolio. As the fund can borrow at institutional rates, this is generally the case. However, the use of leverage is a double-edged sword and it increases losses when the market moves against you. Thus, we want to ensure that the fund does not carry too much leverage. As of the time of writing, the fund had total effective leverage of 38.49%, which is slightly higher than what many similar closed-end funds carry but it is not too bad. Therefore, it does appear that the fund is carrying enough leverage to sufficiently enhance returns but is not taking on too much risk from the debt.
Performance
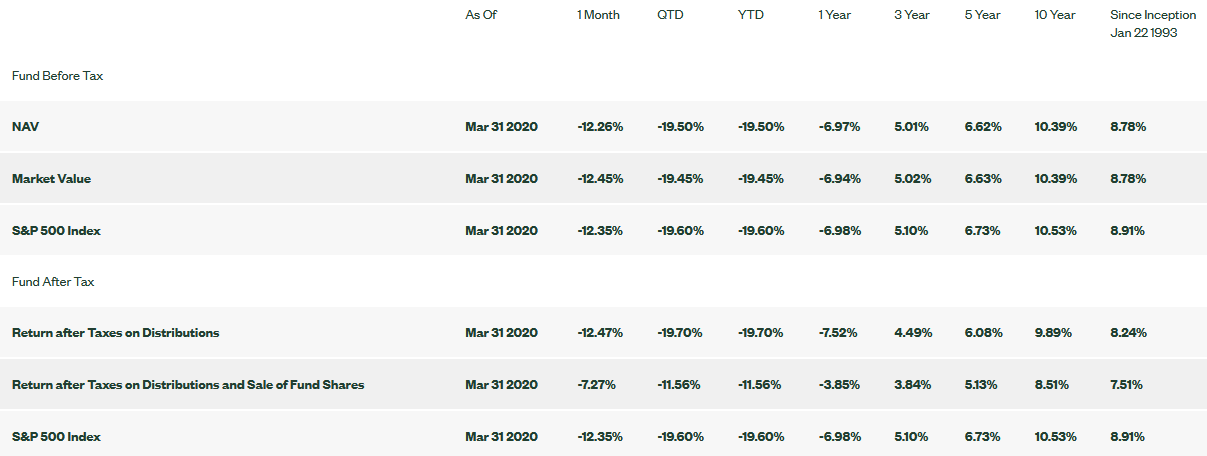
The utilities sector is not particularly well-known for delivering high returns to investors and neither is energy, which has been very volatile over the past several years. In fact, as I have discussed before, the overwhelming majority of the S&P 500 index’s (SPY) returns in recent years have come from just a handful of technology stocks. As such, we might expect HTD to have delivered disappointing returns. This is not the case. Here are the fund’s average annual returns over the usual trailing historical periods:
(Click on image to enlarge)

Source: John Hancock Investment Management
This actually compares very well to the S&P 500 index but somewhat less volatility. Here are the performance numbers for the SPDR S&P 500 ETF Trust:
(Click on image to enlarge)

Source: State Street
As we can see here, HTD actually beat the S&P 500 over the past ten years, which was a rather impressive feat. It has also done a much better job at protecting investors’ wealth so far this year, which is rather surprising given this fund’s allocation to energy. It could have delivered even higher returns if you chose to reinvest the distributions. This is something that should appear to both conservative income-seeking investors and those looking to grow their wealth over the long-term.
Distributions
The basic purpose of this fund is to generate an income for its investors and it accomplishes this by investing in relatively high-yielding stocks. The fund also utilizes leverage to increase its dividend income. This allows the fund to boast a reasonably attractive distribution yield. The fund pays out a monthly distribution of $0.138 per share ($1.656 per share annually), which gives it a 8.30% yield at the current market price.
One thing that may concern potential investors about these distributions is that a sizable proportion of them are classified as return of capital. We can see this here:

Source: Fidelity Investments
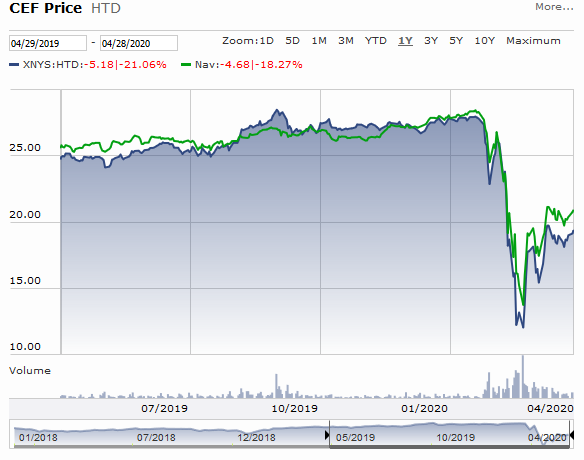
The reason why this may be concerning is that a return of capital distribution can be a sign that the fund is not generating enough money off of its investments to cover the distribution that it pays out. Thus, it could be a sign that the fund is returning its investors’ own money back to them. Obviously, such a scenario is not sustainable over any kind of extended period. There are other things that can cause a distribution to be classified as return of capital though such as the distribution of unrealized capital gains or the distribution of money received from partnerships. The important thing is whether or not the distributions are destructive to net asset value. Fortunately, this does not appear to be the case. This chart shows the fund’s price and net asset value over the past year:

Source: Morningstar
As we can see here, the fund’s net asset value generally increased over the past year until we entered into the current market crisis. This was in spite of the return of capital distributions. Thus, it does not appear that the fund is paying out more than it can afford and investors should just sit back and enjoy the tax-advantaged distributions.
Valuation
As is always the case, it is critical that we do not overpay for any asset in our portfolios. This is because overpaying for any asset is a surefire way to generate sub-optimal returns off of it. In the case of a closed-end fund like HTD, the usual way to value it is by looking at a metric known as net asset value. A fund’s net asset value is the total market value of all of the fund’s assets, minus any outstanding debt. It is therefore the amount that the fund’s investors would receive if the fund were immediately shut down and liquidated.
Ideally, we want to purchase shares of a fund when we can obtain them at a price that is less than net asset value. Fortunately, that is the case right now. As of April 29, 2020 (the most recent date for which data was available as of the time of writing), the fund had a net asset value of $20.93 per share but the fund only trades hands for $19.96 per share. This represents a 4.63% discount to net asset value. This is a reasonable price to pay for the fund.
Conclusion
In conclusion, the John Hancock Tax-Advantaged Dividend Income Fund is a reasonably solid way for investors to access a stable and growing stream of income. The fund focuses heavily on the utilities sector, which is likely to be able to weather the current and future economic climate better than most other sectors and sports a high dividend yield to boot. Retirees may especially like the fund because the yield that it throws off will help ensure that you do not actually have to sell the assets that you worked hard to accumulate in order to maintain your standard of living. The fund also trades at a discount to net asset value, which means that the price is right. Overall, this fund may be worth considering for your portfolio.
Disclosure: Neither the author nor Powerhedge LLC is invested in any stock that is mentioned in this article.
Disclaimer: All information provided in this article is for entertainment purposes ...
more


Thanks, I'll take a closer look at $HTD.