
How To Use Simple Risk Control For Stocks Like AMC
Once a stock goes flying, it seems as though everyone wants a piece of the action.
Of course, it might be fun to be a part of a big move, but it can also be extremely dangerous to take a trade in something going parabolic.
However, if you are late to the party and you still want to participate, following this simple method to manage risk can keep your money safe along with your emotions in check.
The first thing you must decide is how much you are willing to risk on the trade.
To give an example for an active AMC trade (AMC), let us say we are willing to risk $250.
This is the maximum amount of money we are willing to lose on this single trade.
The second thing you must decide is where on the chart will you exit if the trade does not work out in your favor.
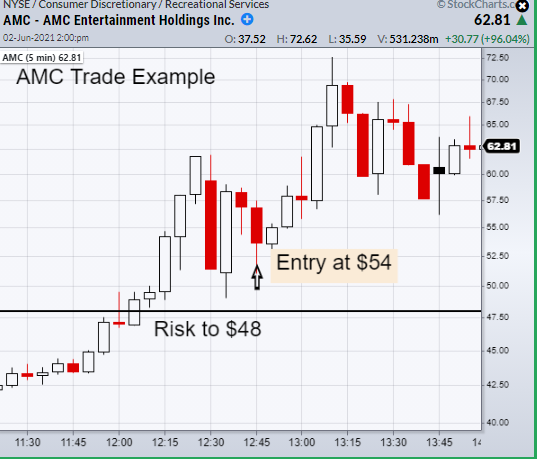
Using the 5 minutes candle-stick chart, let's plan out our trade.
For this example, we will use $48.00.
Now, if we had bought at 12:45 at $54 and decided to risk under the recent low at $48.00, our risk would be $6.00 per share. (54 – 48 = 6)
All we need to do next is divide 6 by our decided dollar risk of $250 and we will get the number of shares we can buy. (250/6 = 41.6)
This means we can buy 41 shares of AMC and if the trade turns against us we have a plan to only lose $250.
Keeping risk limited is a huge part of becoming a consistently profitable trader.
Often, many traders fail to control their risk and end up taking losses that wipe out all their previous gains and sometimes their entire accounts.
By doing this simple calculation not only will you increase the chances of your success by limiting your losses, but it will help preserve your capital and give you the ability to discover your trading edge to repeat your process of picking winning trades.
ETF Summary
S&P 500 (SPY) Resistance 422.82
Russell 2000 (IWM) 226.69 support.
Dow (DIA) 351 highs to clear with 345 support area.
Nasdaq (QQQ) Next resistance 336.65 with 330 support.
KRE (Regional Banks) Like to see this hold over 70.00 with 71.82 resistance.
SMH (Semiconductors) 242.50 support.
IYT (Transportation) 278.85 next resistance. Watching to hold the 10-DMA at 272.71.
IBB (Biotechnology) 151 pivotal area.
XRT (Retail) 96.16 resistance.
Volatility Index (VXX) Inside day.
Junk Bonds (JNK) 108.78 support area from the 50-DMA.
XLU (Utilities) Next support 64.49.
SLV (Silver) 26.43 resistance.
VBK (Small Cap Growth ETF) Flirting with the 50-DMA at 276.61.
UGA (US Gas Fund) Needs to hold over 34.75 area.
TLT (iShares 20+ Year Treasuries) Doji day. Holding over the 50-DMA at 138.06
USD (Dollar) 89.54 support. More sideways price action.
MJ (Alternative Harvest ETF) Watching for a second close over 21.21.
LIT (Lithium) 69.75 next level to clear.
XOP (Oil and Gas Exploration) 92.24 now support.
DBA (Agriculture) 18.73 needs to hold as new support.
GLD (Gold Trust) Minor support the 10-DMA at 177.19. 183.21 high to clear.
Disclaimer: The information provided by us is for educational and informational purposes. This information is based on our trading experience and beliefs. The information on this website is not ...
more

