
How To React To A Choppy Market
Co-Written by Mish and Forrest
We’ve recently talked about higher volatility in the market with the election date closing in.

In these past couple of weeks, we’ve seen the market jump around quite a bit.
We’re in a choppy market environment, and while three of the 4 major indices have broken back over the 50-DMA, we still need to be very cautious in how we trade and what to expect.
To show you what I mean about a choppy market, let’s look at the SPY and IWM.
The SPY ETF represents a collection of the US fortune 500 large cap companies.
Many growth stocks are in the SPY.
The IWM ETF represents a collection of 2000 small cap companies, all within the United States.
Many value stocks are in the IWM.
Analyzing these will give us a good representation of how the overall market has been acting.

From June to the peak in September the market traded in an orderly uptrend fashion.
Since the peak in September, the market is choppy with greater volatility.
I think it’s easy to see which side of the chart you would want to be trading on, and which side is a chop fest!
This week we’ve been trading very close around the 50-DMA, but what would be good to see is a second day close over the 50-DMA putting us back in a bullish phase in SPY.
Even after that, there is resistance close by created in the middle of September, around $343. Keep these levels in mind when looking for potential trades, because you want the market to be on your side.
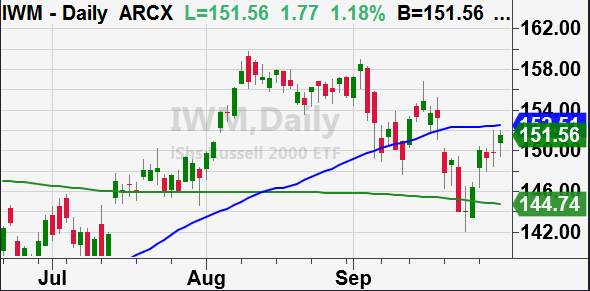
You can also see the similarities in this chart as compared to the SPY.
However, with one major difference.
While the SPY is over its 50-DMA, the IWM has yet to clear its 50-DMA.
As a better measure of the US economy, should IWM rally and hold above the 50-DMA, perhaps October could become less choppy and more orderly with a sustained rally.
S&P 500 (SPY) Closed over the 50-DMA. Needs another close over to confirm bullish phase change.
Russell 2000 (IWM) Still under the 50-DMA, but close.
Dow (DIA) Confirmed bullish phase. 280 resistance
Nasdaq (QQQ) Weekly close over 280 is a good sign.
KRE (Regional Banks) Needs a weekly close over 36.
SMH (Semiconductors) 181 resistance, but can’t argue with gap open
IYT (Transportation) Support 193. 200 Pivotal.
IBB (Biotechnology) Has to clear 138.
XRT (Retail) Closed over the 50-DMA. Needs another close over to confirm bullish phase change.
Disclosure: None. If you'd like more information about the additional free trading education mentioned in ...
more
Comments
 No Thumbs up yet!

