Housing Consistency
The use of weather as an economic excuse, obviously, is meant as a way of avoiding uncomfortable questions and factors. The incongruence of the attempt was most egregious in what came to be known as the Polar Vortex of Q1 2014. The weather was unusually cold, to be sure, but that doesn’t account for why so many economic statistics suddenly fell off and often in alarming fashion.
In the context of early 2014, however, it “had” to be something like wintry winter because the Fed had just declared the economy sufficiently healed so as to begin the tapering of QE. For the mainstream, especially in the form of economists who derive all their analysis from the Fed, that took all macro explanations off the table. Therefore, whatever might be left, no matter how absurd, was used as if an actually plausible account.
It’s not that there weren’t truly legitimate concerns at that time, they just all violated standard Fed assessments. The middle of 2013 was nowhere near a pristine economic environment, free of turmoil and disruption that has become uniquely common. There were currency problems almost anywhere anyone cared to look, as well as domestic turmoil in bond markets. Some of that was due to expectations over “reflation”, but some was more than that, especially in the MBS context.
In general terms, the suddenness of the MBS rout in mid-2013 as well as the intensity of it shocked banks into restricting balance sheet capacity in that channel. Combined with higher nominal interest rates on mortgages, the housing market which had been roaring in a sort of mini-bubble came to a screeching halt. That was highly suspicious, to say the least. As I wrote in February 2014:
By any reasonable token, a healthy home market should not be all that much disturbed by a 100bp rise in the average mortgage rate. And even that likely overstates the degree to which mortgage rates have moved – they briefly reached a record low of about 3.5% at the end of 2012, now settling just below 4.5%. At the tail end of QE2 in the middle of 2011, mortgage rates had just declined to a then-record low of 4.5%, so the context of recent rate levels is somewhat misleading.
It cannot be said that the “market” is functioning when mortgage rates are required to move ever-lower to maintain any positive growth in dispersed finance. This is the Fed’s primary monetary channel, after all, and to have mortgage activity collapse so precipitously on slightly-less-than record low interest rates is a key clue that the overall housing market was again captured in the mirage of “stimulus.” Refi applications are now 63% below year ago levels, and 75% under the 2012 “peak.” The scale of the decline is incongruous with that rise in interest rates, except if you factor the financial end of it.
Cold weather doesn’t apply here. The housing market, for the most part, isn’t a direct macro activity, it is instead indicative and derivative of those that are, especially consumer confidence (the real stuff, not surveys and indices created by surveys). When consumers are actually confident about the actual economy, they will engage in a certain level of demand for new homes as well as the related sales of existing ones.
The nadir of that housing rebuke, for lack of a better term, was in January and February 2014 – the very middle of an economy setback blamed ridiculously on weather.
(Click on image to enlarge)

The housing market came back, but it never really came back. The level of resales estimated by the National Association of Realtors in November 2016 was a high level not seen since the housing bubble a decade earlier, and yet it would have been reached three years before had it not been for this clear disruption rooted in 2013. As housing has gone, so has the economy, again with the former an indication of real conditions in the latter.
With “reflation” again making its way into nominal interest rates, we will see if there are similar effects moving forward. I doubt they will be anywhere near as severe because, as I said in 2014, there were financial considerations amplifying the already-incongruent consumer reaction that won’t repeat. In other words, banks pulled out of mortgages in late 2013 and never truly went back. If there is a repeat on the consumer side this time, it will only be on the consumer side.
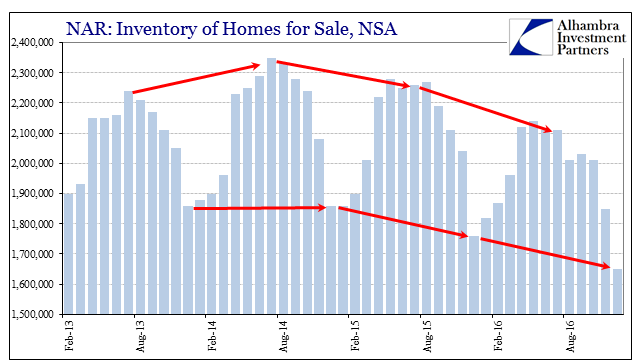
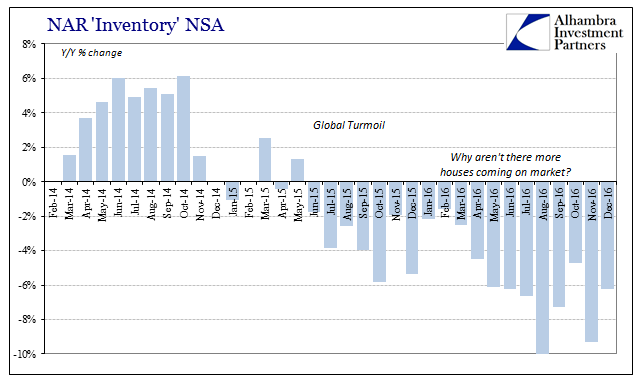
There are many signals that nervousness is and has been the dominant view despite all the hoopla surrounding higher SAAR’s in these past few months. The downturn in late 2013 was in many ways a precursor to the overall economy that would also downshift later in 2014, a bit later than the “Polar Vortex” “anomaly.” Declining inventory starting in 2015 shows just how far and how serious this erosion or attrition had become.
(Click on image to enlarge)

(Click on image to enlarge)

The NAR figures that just 1.65 million houses were available for sale in December 2016. Though December is the smallest month for trade activity, that is still 6.3% less than the inventory listed in December 2015, and 11.3% less than what was available in either December 2014 or December 2013.
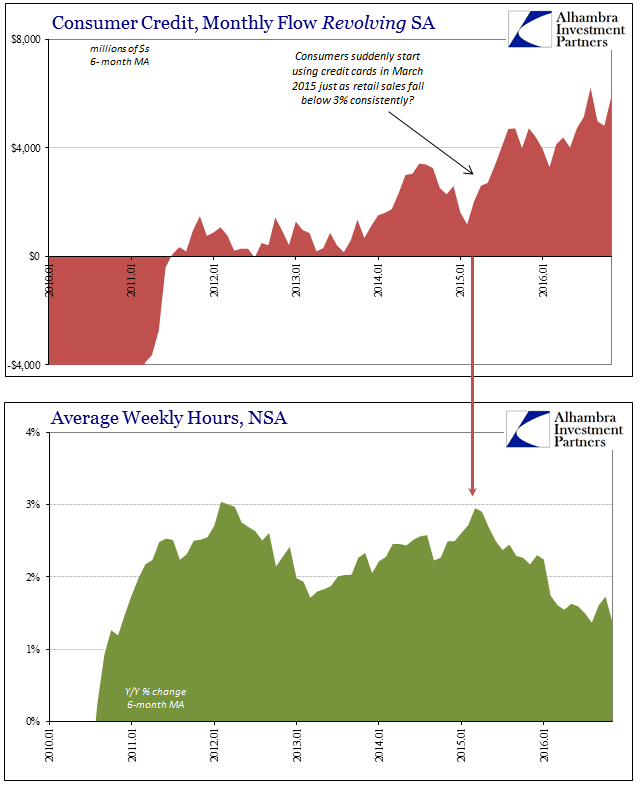
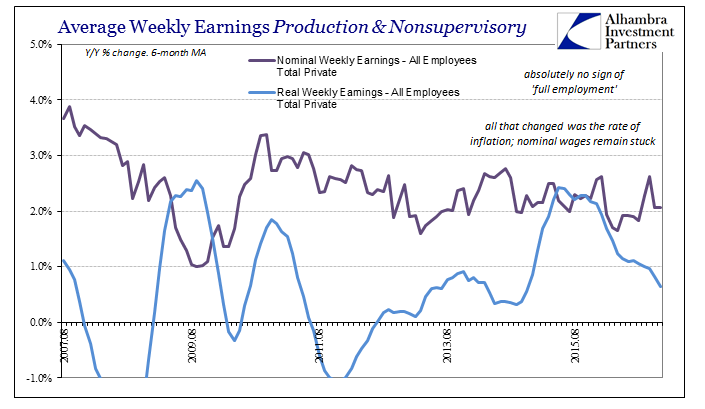
We need not search meteorology for answers this time, either. To figure why prospective sellers have removed themselves from sale considerations we need only review the labor statistics underneath the misunderstood and misappropriate headline figures (particularly the unemployment rate). From hours worked to weekly earnings, there was a clear deceleration in labor utilization in especially 2016 that almost perfectly matches the declines in for-sale homes.
(Click on image to enlarge)

(Click on image to enlarge)

(Click on image to enlarge)

The smaller declines in for-sale inventory during 2015 were likely related to growing reservations about the economic conditions of that year, which by 2016 proved to be well-founded despite the mainstream periphrastic assurances otherwise.
Using nothing more than housing market data, you would have set aside weather excuses in early 2014 in the face of what was really a sharp warning, and then followed the lack of enthusiasm thereafter as at least a cautionary indication no matter how low the unemployment rate fell. While not a perfect proxy for the overall economy, with the coincident appearance of inventory contraction the housing market data has actually been a good and consistent secondary caution about the true state of the US economy.
Disclosure:
This material has been distributed fo or informational purposes only. It is the opinion of the author and should not be considered as investment advice or a recommendation ...
more


It's also worth pointing out that the homeownership rate today is lower than it was in early 2009.