Home Prices Falling Fast
Updated data on home prices across the country came out earlier this week when the newest monthly S&P CoreLogic Case Shiller indices were published. This data is lagged by two months, but it gives us a look at where home prices ended the year in 2022.
Below is a table highlighting the month-over-month (m/m) and year-over-year (y/y) percentage change in home prices across the 20 cities tracked by Case Shiller. It also includes the national and composite 10-city and 20-city readings.
Home prices fell sharply from November 2022 to December 2022, with the national index down 0.81% and 11 of 20 cities down more than 1% sequentially. New York and Miami saw the smallest m/m declines with drops of less than 0.3%.
Looking at y/y price changes, while the national index still showed an increase of 5.76% from December 2021 to December 2022, two cities have now seen prices dip into the red on a y/y basis. Seattle home prices fell 1.78% for the full year 2022, while San Francisco prices fell even more at -4.19%. Given the unrelenting pullback in prices over the last six months, we’ll see more and more cities dip into the red on a y/y basis over the next few months.

Where home price trends get interesting is looking at the post-COVID action.In the aftermath of lockdowns, government stimulus, and the shift to “work from home” in many parts of the labor force, home prices across the country absolutely soared.By mid-2022, the national home price index was up 45% from the level it was at in February 2020 just before COVID hit.Areas on the West Coast and in the Southeast saw prices rise even more, with many cities seeing gains of more than 60% at their peaks.
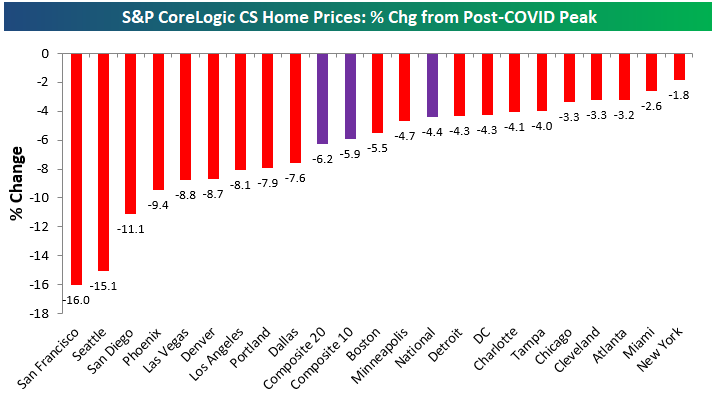
Prices finally peaked last summer, however, as rate hikes by the inflation-fighting Fed quickly pushed mortgage rates to levels not seen in decades.Below is a chart showing how much home prices have fallen from their post-COVID peaks seen in mid-2022.The composite indices are only down 4-6% from their highs, but we’ve seen prices really take a hit out west with cities like San Diego, Seattle, and San Francisco already down double-digit percentage points.

Given the pullbacks in home prices over the past six+ months, below is a look at where prices currently stand relative to their pre-COVID levels at the end of February 2020.Notably, San Francisco — which has seen prices fall the most from their highs — is currently up the least since COVID hit with a gain of 23%.Other cities where home prices are up less post-COVID than the national indices include Minneapolis, DC, Chicago, and Portland.Where home prices are still up the most is in Florida as prices in Tampa and Miami are still up 60% or more. Click here to learn more about Bespoke’s daily premium service.

More By This Author:
Sentiment Back To BearishAnother Week Below 200K For Claims
One Of These Indices Is Not Like The Others
Disclaimer: Bespoke Investment Group, LLC believes all information contained in this report to be accurate, but we do not guarantee its accuracy. None of the information in this report or any ...
more


