Home Prices Coming Down From The Summit
November home price data from S&P CoreLogic Case Shiller was released earlier this week, and below is an updated look at recent changes in prices across the country.
The composite and national indices all fell month-over-month (m/m) for the fifth month in a row, but the year-over-year (y/y) change in prices is still running at +6% or more. Unless prices plummet at an even faster pace over the next couple of months, we likely won’t see a negative y/y number until the March or April 2023 data is released (which won’t be until May/June since the data is released on a two-month lag).

Looking at different parts of the country, cities in the West fell the most m/m with declines of more than 1% in San Francisco, Seattle, San Diego, Phoenix, and Las Vegas. Dallas and Tampa also fell 1%+ m/m, although Miami only fell 20 bps. New York saw prices fall the least of any city at just -0.06% m/m.
Notably, while the national indices are still up 6%+ y/y, San Francisco is the first city to fall into the red on a y/y basis with a decline of 1.57% in prices from November 2021 to November 2022. Tampa and Miami home prices are still up the most y/y with gains of 16.85% and 18.41%, respectively.
We also show how much prices are up since February 2020 just before COVID began as well as how much prices have now fallen from their post-COVID peaks. The national indices are all still up more than 30% from pre-COVID levels, and so far they’ve fallen around 5% from their highs. San Francisco and Seattle have seen the biggest drops in prices with declines of more than 13%, while New York, Chicago, Miami, and Atlanta have seen prices fall the least.


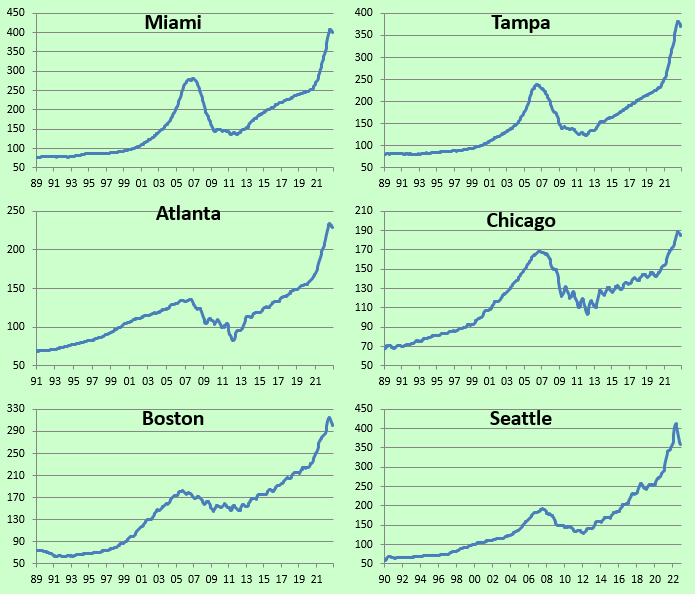
Below are historical price charts of the Case Shiller home price indices for all of the cities covered. While prices look to have peaked, you can see that they’re still extremely elevated relative to any point over the last 30+ years, including the prior housing bubble highs seen in the mid-2000s before the housing crash that occurred alongside the Financial Crisis of 2008/2009. If the peak was the summit of Mt. Everest, we’re still a long way from base camp.


More By This Author:
January 2023 Asset Class And Stock/Sector PerformanceSector Divergence, Earnings Stats
Bad Gas
Click here to learn more about Bespoke’s premium stock market research ...
more


