
Historic Year For The S&P 500
Tomorrow will mark the one-year anniversary of the S&P 500’s closing low from the COVID crash, and for most stocks in the index, it has been a historic year. Within the S&P 500, stocks in the index are up an average of 104.22% through Friday’s close, and just three stocks – all from the Health Care sector – are actually lower. Leading the losers, Gilead (GILD) has declined over 10%. Recall that GILD performed well during the initial stages of the pandemic on the promising results of its drug Remdesivir in treating COVID patients, but once the market started to rally, it was left behind.
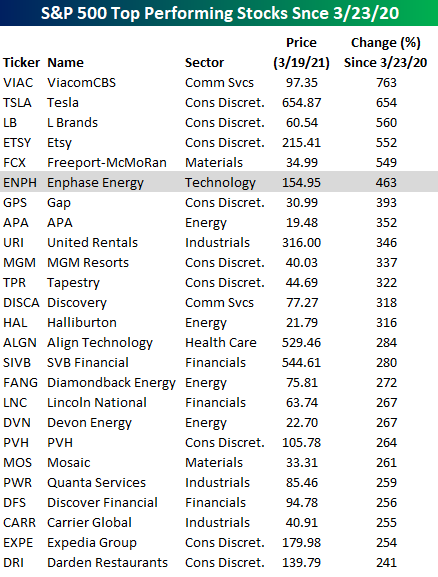
The table below lists the top 25 performing stocks in the S&P 500 since the closing low on 3/23/20. Topping the list with a gargantuan gain of 763% is ViacomCBS (VIAC). After trading below $12 per share last March, the stock is close to triple-digits today. Behind VIAC, Tesla (TSLA), L Brands (LB), Etsy (ETSY), and Freeport-McMoRan (FCX) round out the top five, and all have gained in excess of 500%. Interestingly enough, despite the strength of the sector for what seems like years now, the only stock on the list from the Technology sector is Enphase Energy (ENPH). In fact, after ENPH, you have to go all the way down to the 53rd spot to find the next stock from the Technology sector (Applied Materials – AMAT, +186%).

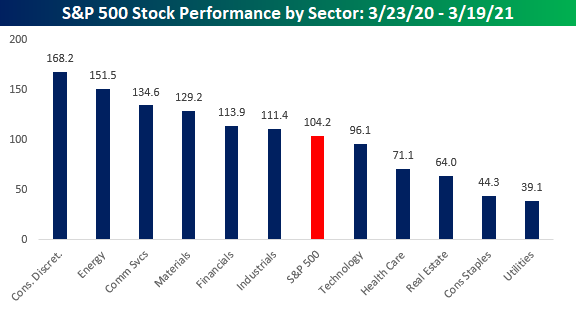
Leading the way higher, stocks in the Consumer Discretionary and Energy sectors are both up an average of over 150%, while Consumer Staples and Utilities are the only two sectors where each one’s components are up an average of less than 50%. Just to the right of the S&P 500 in the chart below is the Technology sector which is one of five sectors where the average performance of its components is less than 100%. A gain of 96.1% in a year is nothing to sneeze at in any market environment, but just the fact that the average performance of stocks in the Technology sector since the March lows is now lower than the average of the S&P 500 illustrates the shift we have seen since the sector’s peak relative strength last fall.
Disclaimer: To begin receiving both our technical and fundamental analysis of the natural gas market on a daily basis, and view our various models breaking down weather by natural gas demand ...
more

