
Since early November 2021, Tesla (TSLA) had a buying climax followed by a topping formation, similar to the S&P 500 futures (ES). This is a classical Wyckoff distribution structure where the smart money sold into strength to distribute the stocks.
After the climatic down move in June 2022, TSLA did not create a lower low like S&P 500, as annotated in the chart below. The relative strength comparison between TSLA and S&P 500 suggested outperformance in TSLA.
The characteristics of the down move in TSLA was not as bearish as S&P 500, which contained wide spread bearish bars with acceleration to the downside. This was another outperformance as manifested in TSLA based on the price action.
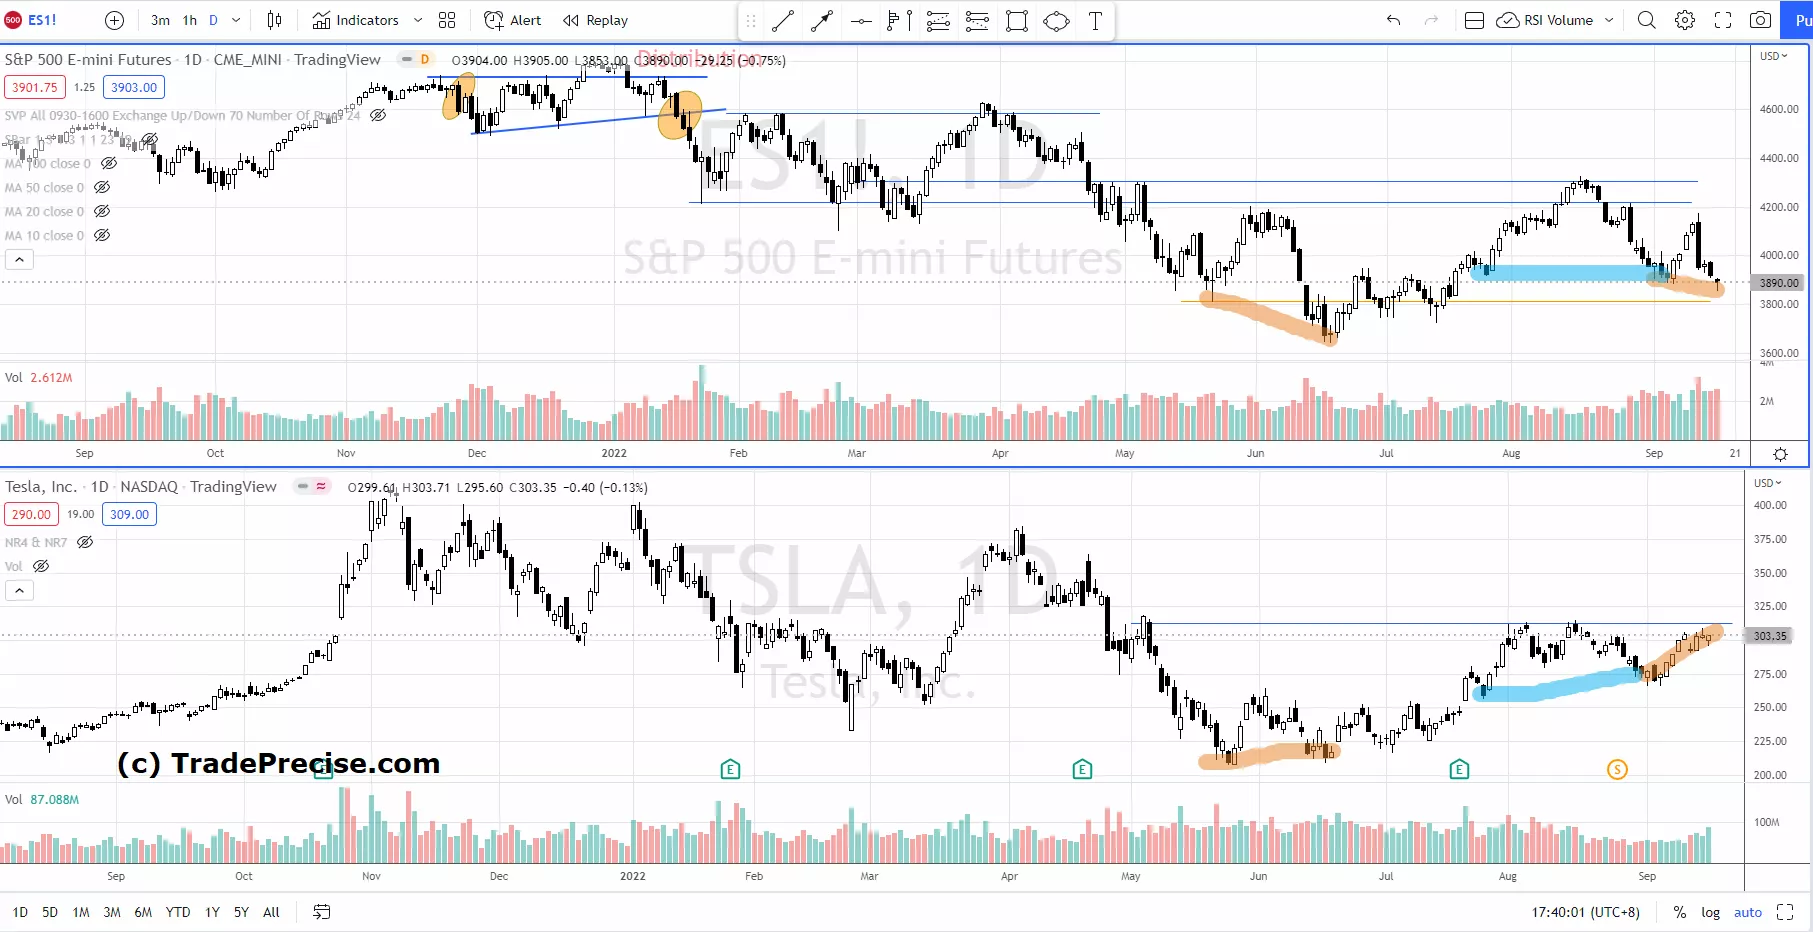
The market correction started on 17 August 2022 took S&P 500 back to the axis line around 3900 where the previous resistance-turned-support. Meanwhile, TSLA formed a higher low at 275 instead of going down to test the axis line at 250, as annotated in blue in the chart above. This structural strength as shown in the relative strength comparison indicated outperformance in TSLA.
The most recent sharp pullback reacting to the CPI data on 13 Sep 2022 caused S&P 500 dipped to a lower low and broke below 3900 while TSLA was holding up the gain and hovering below the immediate resistance at 313 as annotated in the above chart (in orange line). This was the third time where TSLA showed outperformance in the relative strength comparison.
In addition, a cup and handle pattern is showing up in TSLA pending a breakout above the resistance level at 313 as a confirmation for more upside to test 375. The cup and handle pattern is accompanied by decreasing of the volume since August 2022 while forming the handle. This suggests supply is exhausted and TSLA could be ready to have another attempt to initiate a breakout above the resistance level. This bullish chart pattern with accumulation characteristics as explained above is considered as part of the market bottom indicators.
During the stock market bottoming process, strong stocks tend to bottom out first and start to run up ahead of the indices. It is essential to understand how to pick winning stocks to outperform in a bear market and to become a multibagger in the next bull run, as explained in Wednesday's video.
More By This Author:
Here Is How To Pick Winning Stocks To Outperform In A Bear Market Or Market Correction
Wyckoff Accumulation In Bitcoin Reveals Risk On Sentiment Ahead
Failure Of The Market Breadth Thrust? Refer To The Wyckoff Logic From The Bear Market In 2011


Comments
Log in or sign up to join the conversation.