Happy Holidays Above The 200-DMA
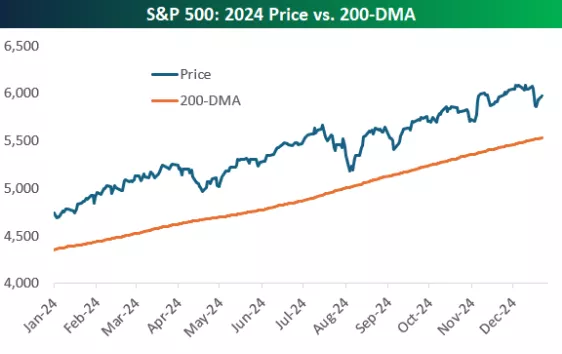
With just a few trading days left, it's a pretty sure bet that the S&P 500 will close out the year above its 200-day moving average, which is something it has done for the entirety of 2024.

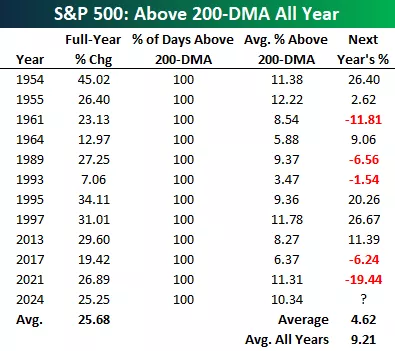
There have been 11 prior years since 1952 (when the NYSE went to the current five-day trading week) that the S&P closed every trading day of the year above its 200-day moving average.This essentially means the index trended higher all year with no significant corrections.For each year listed, we include how the S&P performed in the following year.As you can see at the bottom of the table, the average next-year change following these years has been a gain of just 4.6%, which is about half the historical average annual gain of 9.2%.
The last two times the S&P traded above its 200-DMA all year were 2017 and 2021.Following each of those strong up years, the S&P took a breather in the following year.In 2018, markets trended slightly lower with a big drop to close out the year, while in 2022, the S&P entered a nasty bear market that saw a peak to trough decline of more than 25% from the start of the year through mid-October.

More By This Author:
Market Cap And Equal Weights By Sectors
December Of Discontent
Dow Looks To Avoid 10 In A Row
Disclaimer: Bespoke Investment Group, LLC believes all information contained in this report to be accurate, but we do not guarantee its accuracy. None of the information in this report or any ...
more


